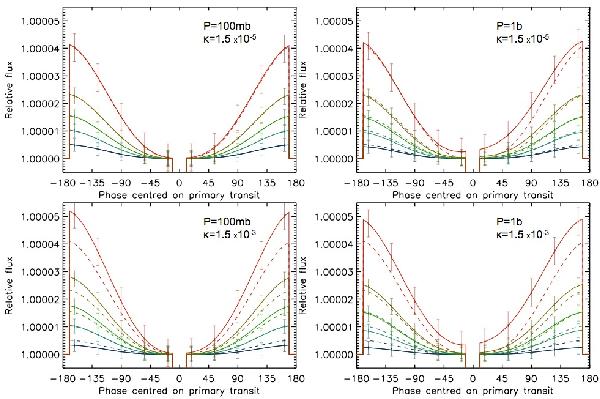
Fig. 11

In these graphics, the five dashed lines represent the phase curve expected for a phase-locked atmosphere-free CoRoT-7b with an albedo of 0.3 in the five channels from 0.8 μm (blue) to 3.5 μm (red). The solid lines represent different situations with a grey atmosphere. The relative flux is plotted as a function of the phase, and the zero phase reference is defined as the primary transit position. The parameters for the atmosphere are: top left: P = 100 mb, κ = 1.5 × 10⁻⁵; top right: P = 1b, κ = 1.5 × 10⁻⁵; bottom left: P = 100 mb, κ = 1.5 × 10⁻³; bottom right: P = 1b, κ = 1.5 × 10⁻³. The IR flux from the cold regions is strongly correlated to the pressure, due to the heat transportation by the atmosphere. The opacity plays a role on the flux from the warmer part of the surface: as the atmosphere becomes more opaque, the substellar region becomes warmer; and the thermal flux is higher when these regions are in front of the observer (around phase 180).
Current usage metrics show cumulative count of Article Views (full-text article views including HTML views, PDF and ePub downloads, according to the available data) and Abstracts Views on Vision4Press platform.
Data correspond to usage on the plateform after 2015. The current usage metrics is available 48-96 hours after online publication and is updated daily on week days.
Initial download of the metrics may take a while.


