Fig. 12
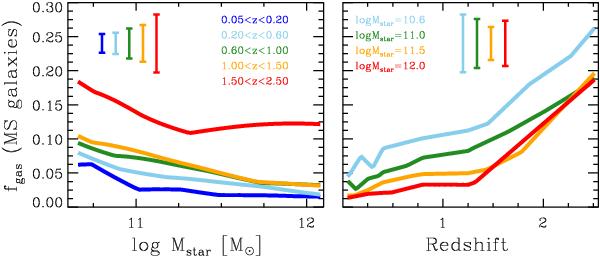
Left: gas fraction vs. Mstar at different redshifts (in different colours according to the legend) for main sequence (MS) galaxies. Right: gas fraction vs. redshift at different Mstar (in different colours according to the legend) for MS galaxies. Curves are obtained by interpolating the fgas parameterizations reported in Fig. 10 and Table 1 and the MS relations (see text for details) at Mstar above the minimum sampled Mstar common to all SFR bins. Mean uncertainties on gas fraction associated to MS galaxies in each redshift (left) or stellar mass (right) bin are plotted.
Current usage metrics show cumulative count of Article Views (full-text article views including HTML views, PDF and ePub downloads, according to the available data) and Abstracts Views on Vision4Press platform.
Data correspond to usage on the plateform after 2015. The current usage metrics is available 48-96 hours after online publication and is updated daily on week days.
Initial download of the metrics may take a while.