Fig. 5
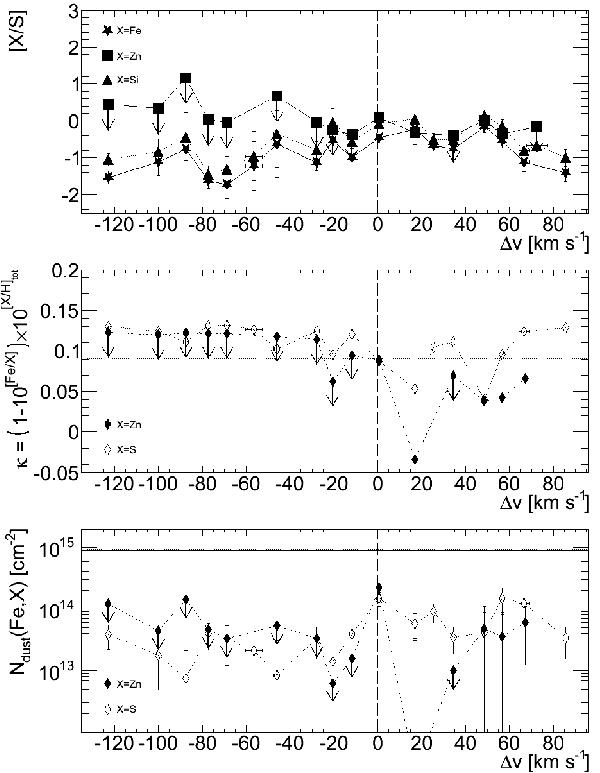
Depletion and dust patterns through the absorption profile. Top panel: depletion of Fe, Zn, and Si with respect to S. Middle panel: dust to gas ratio computed with respect to Zn and S; the horizontal lines show the value of κ obtained when summing all components, using zinc (solid) and sulphur (dotted). Bottom panel: the iron column density in the dust phase computed with respect to Zn and S; horizontal lines mark the integrated value over all the profile, using zinc (solid) and sulphur (dotted). Vertical dashed lines show the C i and H2 component at z = 2.65859(7).
Current usage metrics show cumulative count of Article Views (full-text article views including HTML views, PDF and ePub downloads, according to the available data) and Abstracts Views on Vision4Press platform.
Data correspond to usage on the plateform after 2015. The current usage metrics is available 48-96 hours after online publication and is updated daily on week days.
Initial download of the metrics may take a while.