Fig. A.11
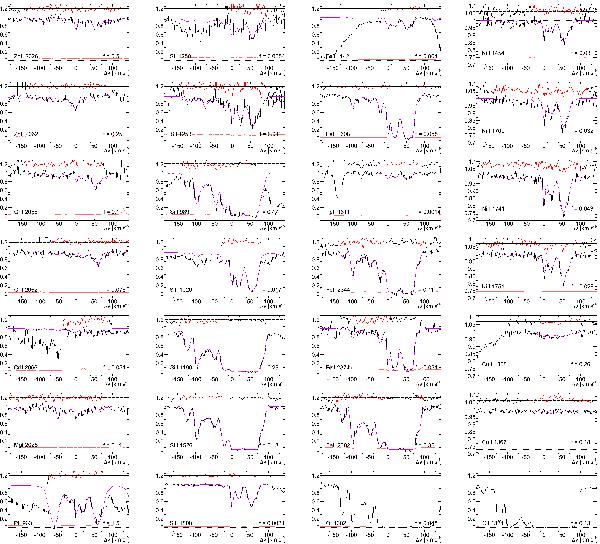
Multiple-component Voigt profile fits to low ionisation element profiles. The fit to the data is represented by a line. Residuals of the fit are shown on top, in red when corresponding to the intervals used for the fit, in black otherwise. The observational error is shown at the bottom for reference. C ii and O i are impossible to decompose because all features are heavily saturated.
Current usage metrics show cumulative count of Article Views (full-text article views including HTML views, PDF and ePub downloads, according to the available data) and Abstracts Views on Vision4Press platform.
Data correspond to usage on the plateform after 2015. The current usage metrics is available 48-96 hours after online publication and is updated daily on week days.
Initial download of the metrics may take a while.