Free Access
Fig. 2
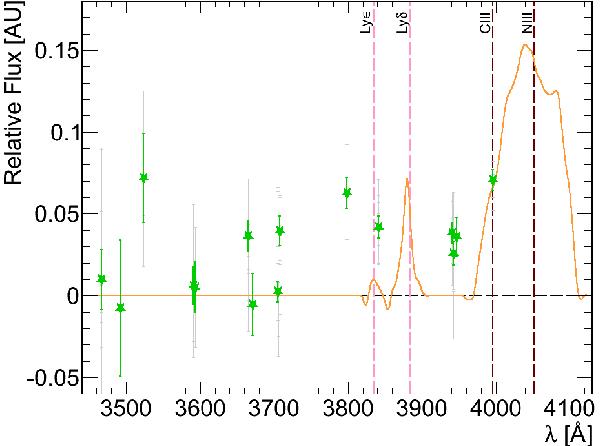
Fraction of emitted flux attributed to the broad-line region associated with Q J 0643−5041 is drawn in solid line. We indicate the position of the emission lines at zem = 3.09. Pixels corresponding to saturated H2 transitions are shown in gray, and in green star points their median at each selected line position.
Current usage metrics show cumulative count of Article Views (full-text article views including HTML views, PDF and ePub downloads, according to the available data) and Abstracts Views on Vision4Press platform.
Data correspond to usage on the plateform after 2015. The current usage metrics is available 48-96 hours after online publication and is updated daily on week days.
Initial download of the metrics may take a while.