Fig. A.1
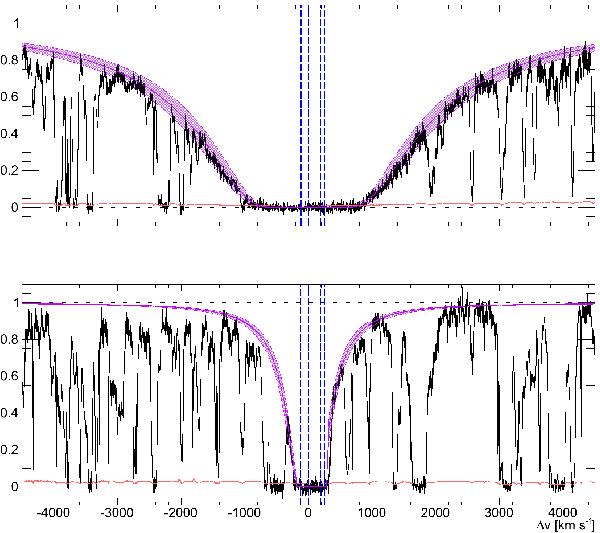
Voigt profile fits to the DLA: Lyman-α transition on top, Lyman-β at lower panel. The fit to the data with its uncertainty is shown in the shaded area. Vertical dashed lines mark the position of the H i components used for the fit, determined both from the wings of Lyman-α and Lyman-β and the profile of higher Lyman transitions. The observational error is shown at the bottom for reference.
Current usage metrics show cumulative count of Article Views (full-text article views including HTML views, PDF and ePub downloads, according to the available data) and Abstracts Views on Vision4Press platform.
Data correspond to usage on the plateform after 2015. The current usage metrics is available 48-96 hours after online publication and is updated daily on week days.
Initial download of the metrics may take a while.