Fig. 11
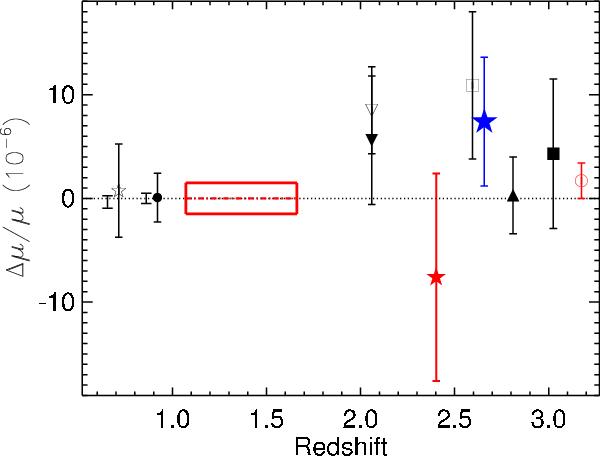
Comparison of Δμ/μ measurement in this work and those in the literature. All measurements at 2.0 < z < 3.1 are based on the analysis of H2 absorption. The filled larger blue star shows our result and the smaller red star shows the result from Rahmani et al. (2013). The downwards empty and filled triangles are the Δμ/μ measurements from van Weerdenburg et al. (2011) and Malec et al. (2010). The filled upward triangle and the empty and filled squares are, respectively, from King et al. (2008; 2011), and Wendt & Molaro (2012). The solid box and the open circle present the constraint obtained, respectively, by Rahmani et al. (2012) and Srianand et al. (2010) based on the comparison between 21-cm and metal lines in Mg ii absorbers under the assumption that α and gp have not varied. The Δμ/μ at z < 1 are based on ammonia and methanol inversion transitions: their 5σ errors are shown. The two measurements at z ~ 0.89 with larger and smaller errors are, respectively, from Henkel et al. (2009) and Bagdonaite et al. (2013) based on the same system. The two Δμ/μ at z ~ 0.684 with larger and smaller errors are, respectively, from Murphy et al. (2008) and Kanekar (2011) based on the same system.
Current usage metrics show cumulative count of Article Views (full-text article views including HTML views, PDF and ePub downloads, according to the available data) and Abstracts Views on Vision4Press platform.
Data correspond to usage on the plateform after 2015. The current usage metrics is available 48-96 hours after online publication and is updated daily on week days.
Initial download of the metrics may take a while.