Fig. 1
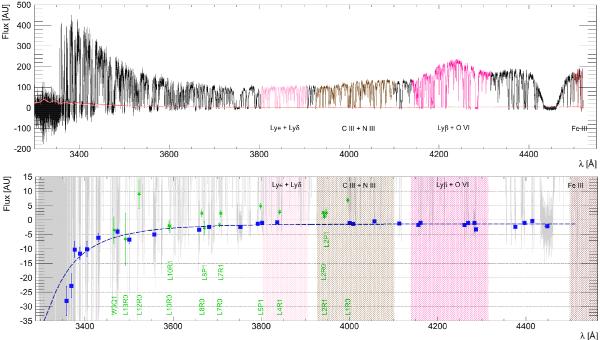
Top panel: Q J 0643−5041 spectrum obtained after combining the 15 exposures with central grating setting at 390 nm and attached ThAr lamp exposure for wavelength calibration. In colours, the broad-line emission line intervals as expected from the composite emission spectrum of quasars from Vanden Berk et al. (2001) at zem = 3.09. Bottom panel: the median of the selected intervals from saturated Lyman-α forest absorption lines for the analysis of the zero level are shown in blue square points. The error bar on the wavelength is simply the selected interval. The error bar on the flux is the error on the mean measured flux of the selected pixels. The dashed line is the fit to the medians taking the errors into account. Green star points represent the median level at the bottom of saturated and unblended H2 lines. We compute error bars equivalent to those of blue points. We show the broad-line region expected extension as given in Vanden Berk et al. (2001) in shaded colours, and the flux measured in gray in the background.
Current usage metrics show cumulative count of Article Views (full-text article views including HTML views, PDF and ePub downloads, according to the available data) and Abstracts Views on Vision4Press platform.
Data correspond to usage on the plateform after 2015. The current usage metrics is available 48-96 hours after online publication and is updated daily on week days.
Initial download of the metrics may take a while.