Fig. 8
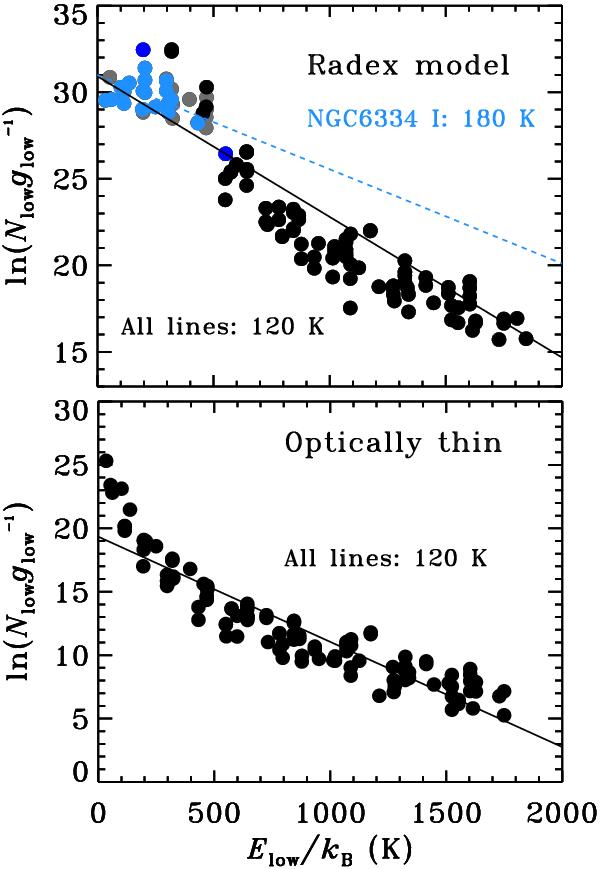
Top: rotational diagram of H2O calculated assuming a kinetic temperature T = 1000 K, H2 density n = 106 cm-3, H2O column density 2 × 1016 cm-2, and line width ΔV = 5 km s-1. Lines observed in absorption in NGC 6334-I are shown in blue. Fits are done to all lines in the PACS range included in the LAMDA database (Schöier et al. 2005) (in black) and to the NGC 6334-I lines (in blue). Darker shades denote optically thin lines. Bottom: the same as above, but assuming an H2O column density 1012 cm-2, such that all lines are optically thin.
Current usage metrics show cumulative count of Article Views (full-text article views including HTML views, PDF and ePub downloads, according to the available data) and Abstracts Views on Vision4Press platform.
Data correspond to usage on the plateform after 2015. The current usage metrics is available 48-96 hours after online publication and is updated daily on week days.
Initial download of the metrics may take a while.