Fig. 6
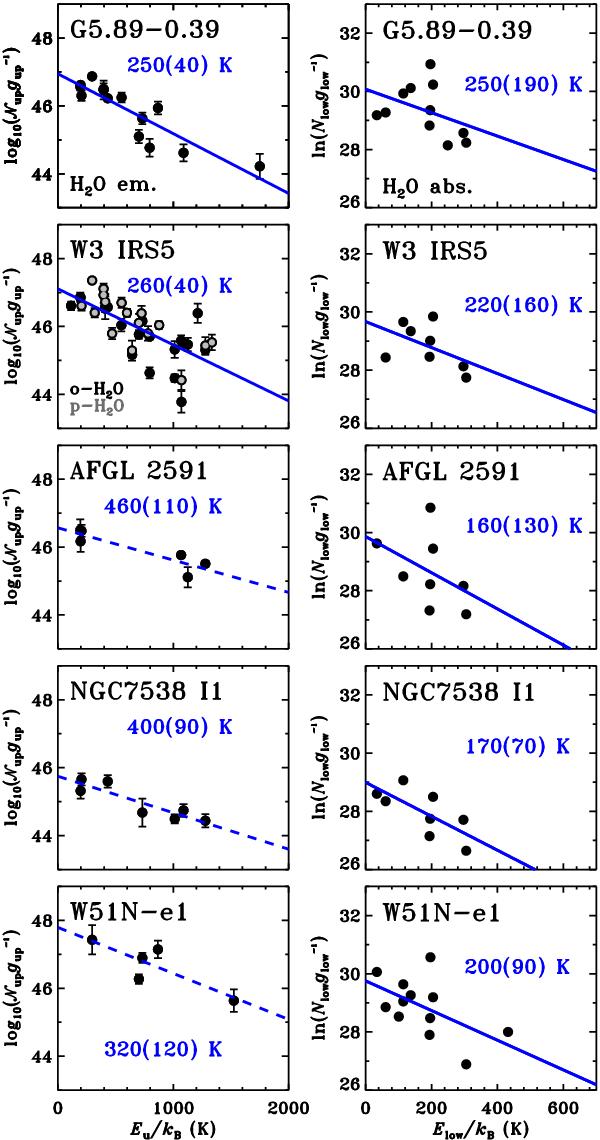
Rotational diagrams of H2O calculated using emission lines (left column) and absorption lines (right column), respectively. For emission line diagrams, the logarithm with base 10 of total number of molecules in a level u,  , divided by the degeneracy of the level, gu, is shown as a function of energy of the upper level in Kelvins, Elow. For absorptions lines, the natural logarithm of the column density in a level l, Nl, divided by the degeneracy of the level, gl, is shown in y-axis. A one-component linear fit is shown with the corresponding value of rotational temperature and error of the fit in brackets. A solid line is used for the cases where at least 10 lines are detected. In the W3 IRS5 emission panel, para-H2O lines are shown in gray and ortho-H2O lines in black, respectively.
Current usage metrics show cumulative count of Article Views (full-text article views including HTML views, PDF and ePub downloads, according to the available data) and Abstracts Views on Vision4Press platform.
Data correspond to usage on the plateform after 2015. The current usage metrics is available 48-96 hours after online publication and is updated daily on week days.
Initial download of the metrics may take a while.