Free Access
Fig. 4
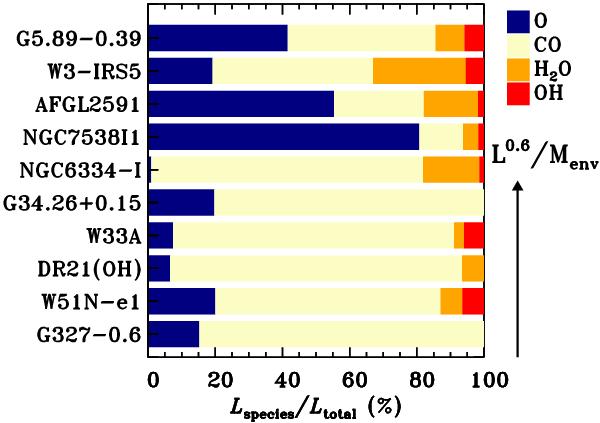
Relative contributions of [O i] (dark blue), CO (yellow), H2O (orange), and OH (red) cooling to the total far-IR gas cooling at central position are shown from left to right horizontally for each source. The objects follow the evolutionary sequence with the most evolved sources on top.
Current usage metrics show cumulative count of Article Views (full-text article views including HTML views, PDF and ePub downloads, according to the available data) and Abstracts Views on Vision4Press platform.
Data correspond to usage on the plateform after 2015. The current usage metrics is available 48-96 hours after online publication and is updated daily on week days.
Initial download of the metrics may take a while.