Fig. 3
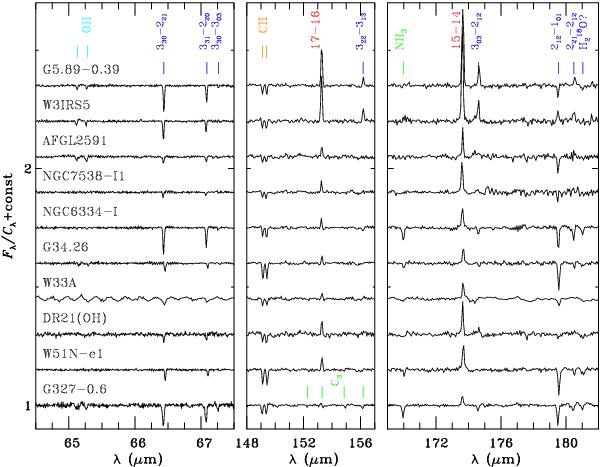
Normalized spectral regions of all our sources at the central position at 64–68, 148–157, and 169–182 μm. Objects are shown in the evolutionary sequence, with the most evolved ones on top. Lines of CO are shown in red, H2O in blue, OH in light blue, CH in orange, and NH3 and C3 in green. Spectra are shifted vertically to improve the clarity of the figure.
Current usage metrics show cumulative count of Article Views (full-text article views including HTML views, PDF and ePub downloads, according to the available data) and Abstracts Views on Vision4Press platform.
Data correspond to usage on the plateform after 2015. The current usage metrics is available 48-96 hours after online publication and is updated daily on week days.
Initial download of the metrics may take a while.