Free Access
Fig. 11
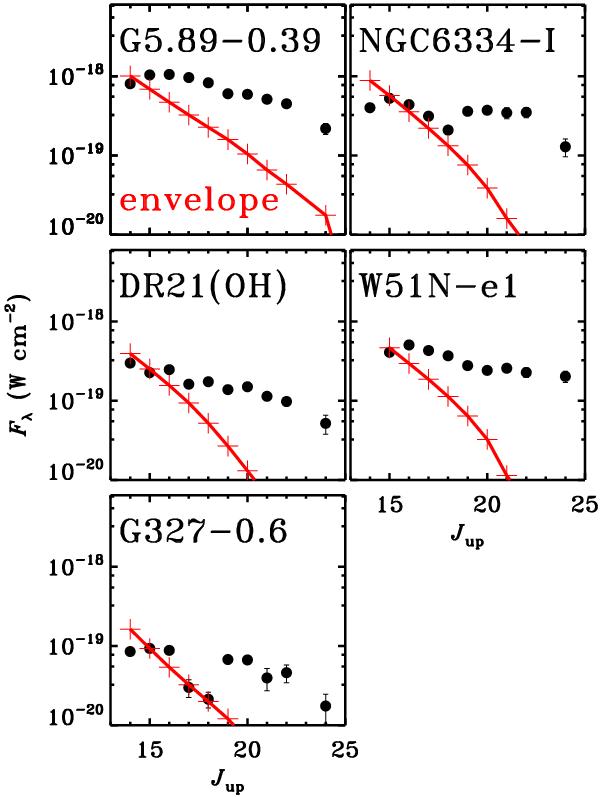
Comparison of integrated line fluxes of CO observed by PACS only (black dots with error bars) and the predictions of the quiescent envelope passively heated by the luminosity of the source (red crosses).
Current usage metrics show cumulative count of Article Views (full-text article views including HTML views, PDF and ePub downloads, according to the available data) and Abstracts Views on Vision4Press platform.
Data correspond to usage on the plateform after 2015. The current usage metrics is available 48-96 hours after online publication and is updated daily on week days.
Initial download of the metrics may take a while.