Free Access
Fig. 11
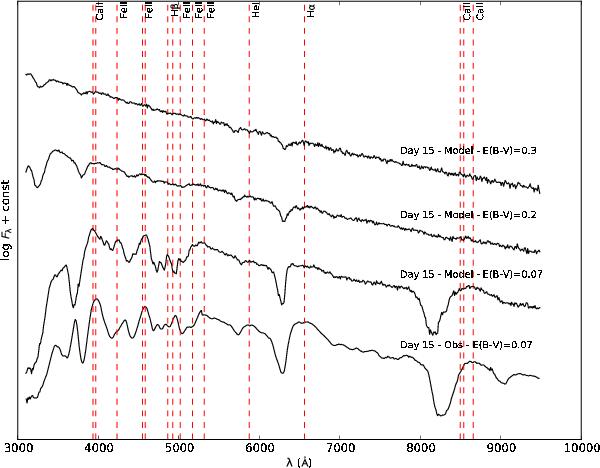
Modelled and observed optical spectrum at 15 days. Lines identified by their optical depth being ≳1 have been marked at their rest wavelength. We also show model spectra for two higher extinction scenarios, E(B − V)T = 0.2 mag and E(B − V)T = 0.3 mag, discussed in Sect. 5.1.
Current usage metrics show cumulative count of Article Views (full-text article views including HTML views, PDF and ePub downloads, according to the available data) and Abstracts Views on Vision4Press platform.
Data correspond to usage on the plateform after 2015. The current usage metrics is available 48-96 hours after online publication and is updated daily on week days.
Initial download of the metrics may take a while.