Fig. 6
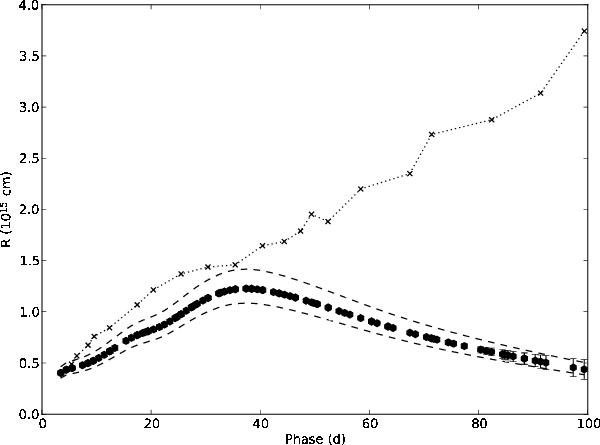
Evolution of blackbody radius for SN 2011dh as inferred from fits to the V, I, J, H and K bands for the adopted extinction. The upper and lower error bars for the systematic error arising from extinction and distance (black dashed lines) and the radius corresponding to the P-Cygni minimum of the Fe ii 5169 Å line (black dotted line) are also shown.
Current usage metrics show cumulative count of Article Views (full-text article views including HTML views, PDF and ePub downloads, according to the available data) and Abstracts Views on Vision4Press platform.
Data correspond to usage on the plateform after 2015. The current usage metrics is available 48-96 hours after online publication and is updated daily on week days.
Initial download of the metrics may take a while.