Free Access
Fig. 18
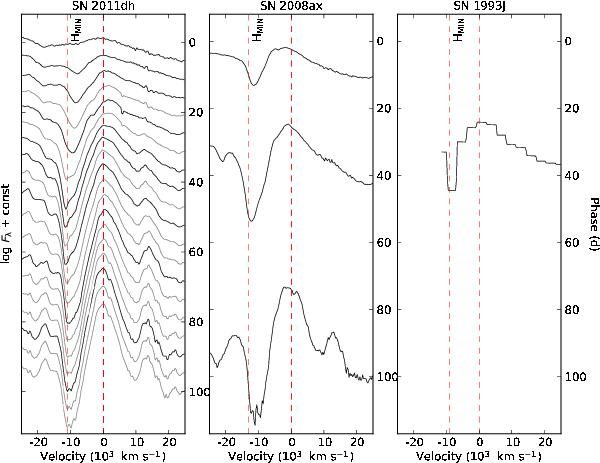
The (interpolated) evolution of the He i 10 830 Å line for SN 2011dh (left panel) as compared to SNe 2008ax (middle panel) and 1993J (right panel). Given the sparse data available for SNe 1993J and 2008ax we show observed spectra for these SNe.
Current usage metrics show cumulative count of Article Views (full-text article views including HTML views, PDF and ePub downloads, according to the available data) and Abstracts Views on Vision4Press platform.
Data correspond to usage on the plateform after 2015. The current usage metrics is available 48-96 hours after online publication and is updated daily on week days.
Initial download of the metrics may take a while.