Free Access
Fig. 12
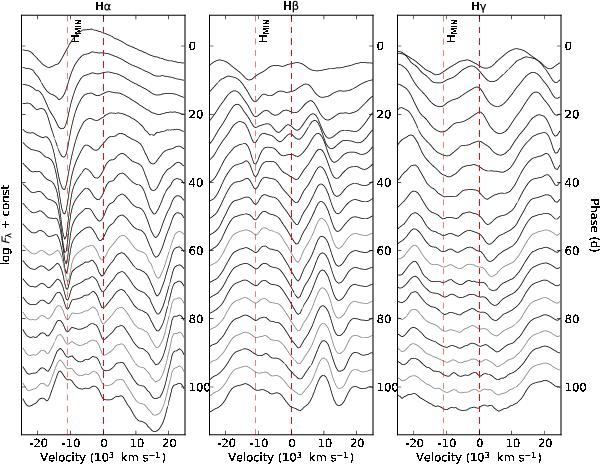
Closeup of (interpolated) spectral evolution centred on the Hα (left panel), Hβ (middle panel) and Hγ (right panel) lines. All panels in this and the following figure show the minimum velocity for the Hα absorption minimum (marked HMIN) interpreted as the interface between the helium core and hydrogen envelope.
Current usage metrics show cumulative count of Article Views (full-text article views including HTML views, PDF and ePub downloads, according to the available data) and Abstracts Views on Vision4Press platform.
Data correspond to usage on the plateform after 2015. The current usage metrics is available 48-96 hours after online publication and is updated daily on week days.
Initial download of the metrics may take a while.