Fig. 5
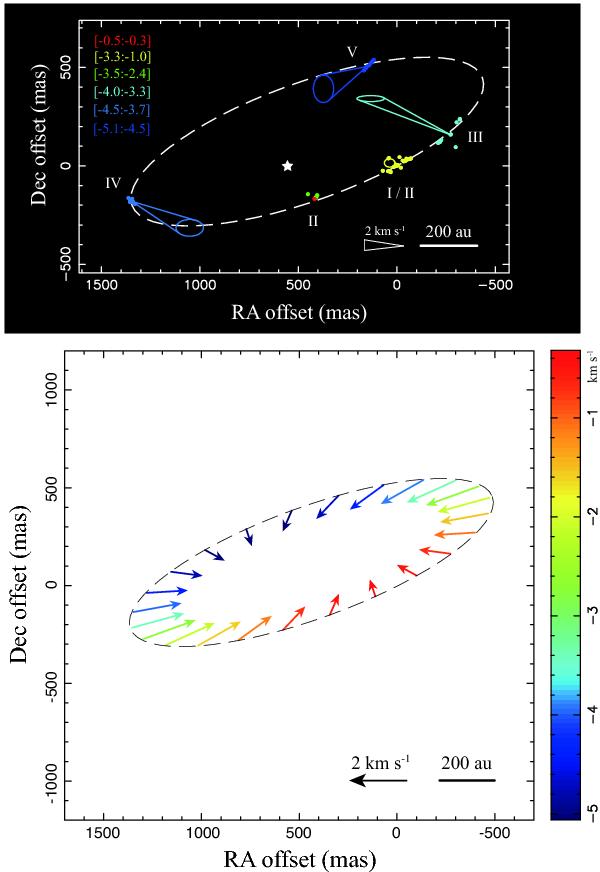
Upper panel: internal proper motions averaged over all the persistent spots in each maser cluster, as listed in Table 3. Cones show the averaged proper motions in each cluster (the aperture of the cone corresponds to the uncertainty). The origin of each cone is located at the brightest spot in each cluster. The star represents the location of the 43 GHz continuum peak (as in Fig. 2). The dashed ellipse corresponds to the fitted elliptical structure for the methanol maser emission. Colors indicate the LSR velocity of maser clusters, with the range of LSR velocities within a cluster ([min:max]) shown in the top left corner. Lower panel: internal proper motions predicted from the fitted disk model including rotation and infall (see Sect. 4.1). The horizontal and vertical axes give the RA and Dec coordinates. The spatial scale is indicated by the bar at the bottom right corner of the plot. Colors indicate the LSR velocity of the maser emission located in the disk, using the same color velocity conversion code (shown on the right of the panel) as in the upper panel. The dashed ellipse is identical to that shown in the upper panel.
Current usage metrics show cumulative count of Article Views (full-text article views including HTML views, PDF and ePub downloads, according to the available data) and Abstracts Views on Vision4Press platform.
Data correspond to usage on the plateform after 2015. The current usage metrics is available 48-96 hours after online publication and is updated daily on week days.
Initial download of the metrics may take a while.