Fig. 3
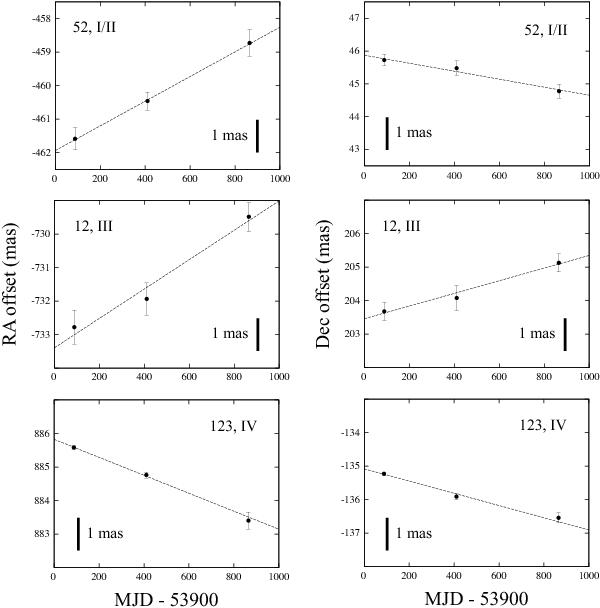
Linear fits of the change with time (MJD) of the relative positional offset with respect to the barycenter in right ascension (left panels) and declination (right panels). Numbers and the roman numerals identify the spot ID and the cluster as given in Table 5, respectively. The dotted line indicates the linear fit.
Current usage metrics show cumulative count of Article Views (full-text article views including HTML views, PDF and ePub downloads, according to the available data) and Abstracts Views on Vision4Press platform.
Data correspond to usage on the plateform after 2015. The current usage metrics is available 48-96 hours after online publication and is updated daily on week days.
Initial download of the metrics may take a while.