Free Access
Fig. 9
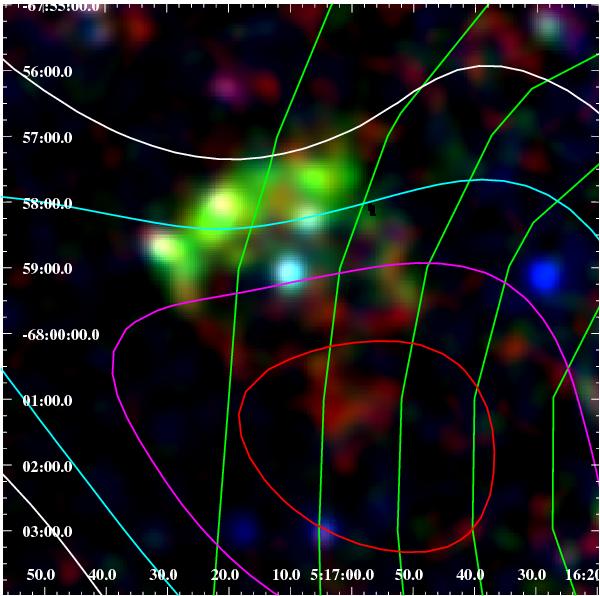
Same as Fig. 7 for MCSNR J0517−6759, with CO contours from the NANTEN survey added in green. The H i levels shown are 2.0, 2.25, 2.5, and 2.75 (in units of 1021 cm-2), in white, cyan, magenta, and red, respectively. CO contours are from 1σ to 5σ, in steps of 1σ (≈0.4 K km s-1), and increase westwards.
Current usage metrics show cumulative count of Article Views (full-text article views including HTML views, PDF and ePub downloads, according to the available data) and Abstracts Views on Vision4Press platform.
Data correspond to usage on the plateform after 2015. The current usage metrics is available 48-96 hours after online publication and is updated daily on week days.
Initial download of the metrics may take a while.