Fig. 6
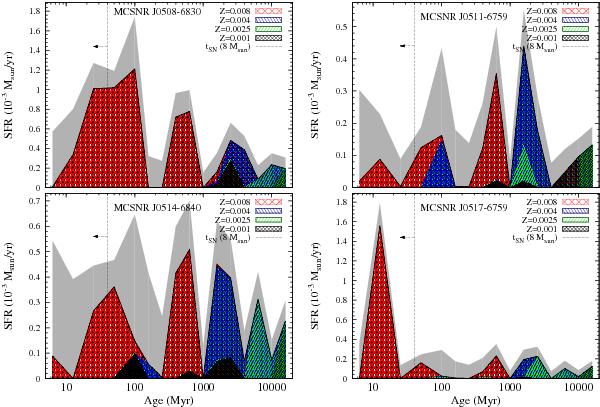
Star formation history around the remnants. Data are taken from Harris & Zaritsky (2009). The star formation rate in four metallicity bins are plotted against lookback time. The errors (combining all metallicities) are shown by the gray shading. The vertical dashed line at 40 Myr indicates the maximal lifetime of a CC SN progenitor. Note the changing vertical scale.
Current usage metrics show cumulative count of Article Views (full-text article views including HTML views, PDF and ePub downloads, according to the available data) and Abstracts Views on Vision4Press platform.
Data correspond to usage on the plateform after 2015. The current usage metrics is available 48-96 hours after online publication and is updated daily on week days.
Initial download of the metrics may take a while.