Fig. 5
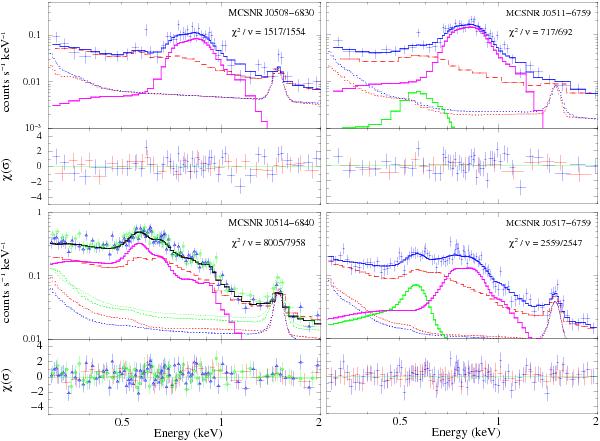
X-ray spectra of the SNRs. Data extracted from the source region are shown by blue data points, with the total (source+background) model as the solid blue line. The red and blue dash-dotted lines show the instrumental background model measured in the background and source extraction regions, respectively. The X-ray+instrumental background model is shown by the dashed red line. For clarity we do not show the data points from the background extraction region but only the residuals of the fit (red points in the lower panels). For MCSNR J0514−6840, spectra from two overlapping observations are shown by the green squares and blue triangles. The thick magenta lines show the source emission component. When more than one component is in the SNR emission model (see text for individual description), the secondary component is shown by the thick green line. The residuals are shown in terms of σ.
Current usage metrics show cumulative count of Article Views (full-text article views including HTML views, PDF and ePub downloads, according to the available data) and Abstracts Views on Vision4Press platform.
Data correspond to usage on the plateform after 2015. The current usage metrics is available 48-96 hours after online publication and is updated daily on week days.
Initial download of the metrics may take a while.