Fig. 3
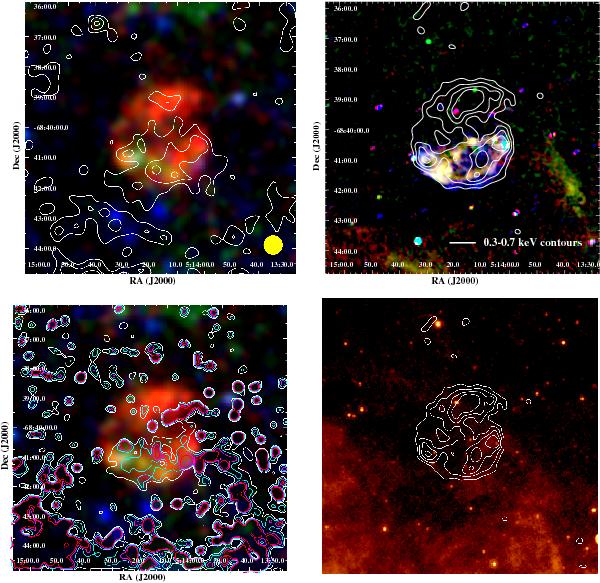
Same as Fig. 1 for MCSNR J0514−6840. On the XMM-Newton image (top left) the 4800 MHz contours are shown in white. Levels are at 1.5, 2, 2.5, and 3 mJy beam-1. The yellow disc in the lower right corner indicates the half-power beamwidth of 35′′. The X-ray contours used on the optical image (top right) are from the soft X-ray image. On the MIPS image (bottom right) the X-ray contours are used to locate the position of the remnant, rather than the (noisy) [S ii]/Hα ratio contours.


Current usage metrics show cumulative count of Article Views (full-text article views including HTML views, PDF and ePub downloads, according to the available data) and Abstracts Views on Vision4Press platform.
Data correspond to usage on the plateform after 2015. The current usage metrics is available 48-96 hours after online publication and is updated daily on week days.
Initial download of the metrics may take a while.