Free Access
Fig. 7
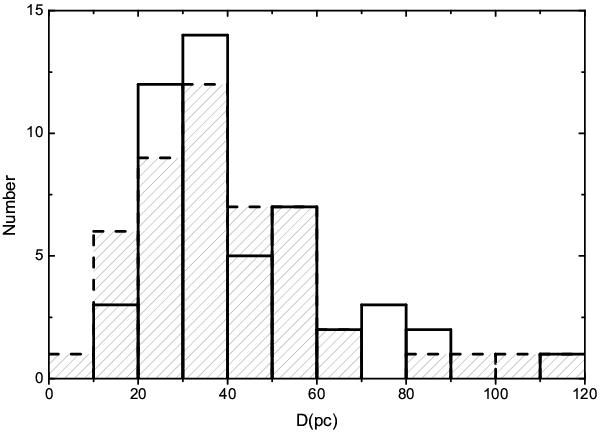
Diameter distribution of SNRs with −0.7 ≤ HR ≤ −0.3 in M 33 (dashed lines) and modeled SNRs (solid lines). The data for 48 SNRs in M 33 are taken from L10, the 49 modeled SNRs represent the scenario of 90% warm gas filling-factor and a birthrate of 150 yr. The size of the bins is 10 pc.
Current usage metrics show cumulative count of Article Views (full-text article views including HTML views, PDF and ePub downloads, according to the available data) and Abstracts Views on Vision4Press platform.
Data correspond to usage on the plateform after 2015. The current usage metrics is available 48-96 hours after online publication and is updated daily on week days.
Initial download of the metrics may take a while.