Free Access
Fig. 5
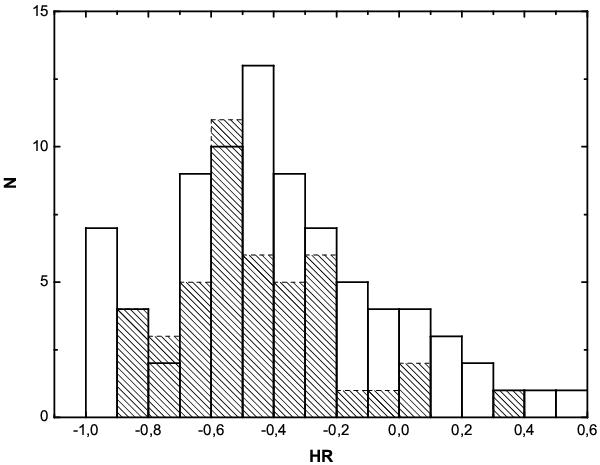
Hardness ratio distribution of SNRs in M 33. The solid line histogram corresponds to 82 SNRs from L10, the histogram for 45 SNRs with HRs calculated by using the data from T11 is drawn with dashed lines.
Current usage metrics show cumulative count of Article Views (full-text article views including HTML views, PDF and ePub downloads, according to the available data) and Abstracts Views on Vision4Press platform.
Data correspond to usage on the plateform after 2015. The current usage metrics is available 48-96 hours after online publication and is updated daily on week days.
Initial download of the metrics may take a while.