| Issue |
A&A
Volume 561, January 2014
|
|
|---|---|---|
| Article Number | A117 | |
| Number of page(s) | 5 | |
| Section | Stellar structure and evolution | |
| DOI | https://doi.org/10.1051/0004-6361/201322719 | |
| Published online | 17 January 2014 | |
Swift X-ray and ultraviolet observations of the shortest orbital period double-degenerate system RX J0806.3+1527 (HM Cnc)
1 Istituto di Astrofisica Spaziale e Fisica Cosmica – Milano, INAF, via E. Bassini 15, 20133 Milano, Italy
e-mail: This email address is being protected from spambots. You need JavaScript enabled to view it.
2 Osservatorio Astronomico di Roma, INAF, via di Frascati 33, 00040 Monteporzio Catone (Roma), Italy
3 Theoretische Astrophysik, IAAT, Eberhard Karls Universität Tübingen, Sand 1, 72076 Tübingen, Germany
4 Osservatorio Astronomico di Brera, INAF, via E. Bianchi 46, 23807 Merate (LC), Italy
Received: 20 September 2013
Accepted: 27 November 2013
Abstract
The system RX J0806.3+1527 (HM Cnc) is a pulsating X-ray source with 100 per cent modulation on a period of 321.5 s (5.4 min). This period reflects the orbital motion of a close binary consisting of two interacting white dwarfs. Here we present a series of simultaneous X-ray (0.2–10 keV) and near-ultraviolet (2600 Å and 1928 Å) observations that were carried out with the Swift satellite. In the near-ultraviolet, the counterpart of RX J0806.3+1527 was detected at flux densities consistent with a blackbody with a temperature of (27 ± 8) × 103 K. We found that the emission at 2600 Å is modulated at the 321.5-s period with the peak ahead of the X-ray one by 0.28 ± 0.02 cycles and is coincident within ± 0.05 cycles with the optical. This phase-shift measurement confirms that the X-ray hot spot (located on the primary white dwarf) is at about 80°–100° from the direction that connects the two white dwarfs. Albeit at lower significance, the 321.5-s signature is also present in the 1928-Å data; at this wavelength, however, the pulse peak is better aligned with that observed at X-rays. We use the constraints on the source luminosity and the geometry of the emitting regions to discuss the merits and limits of the main models for RX J0806.3+1527.
Key words: stars: individual: RX J0806.3+1527 (HM Cnc) / X-rays: binaries / ultraviolet: stars / binaries: close / white dwarfs
© ESO, 2014
1. Introduction
The X-ray emission of RX J0806.3+1527 (also known as HM Cnc) is modulated on a period of 321.5 s (5.4 min) with virtually no emission for about half of the cycle (Israel et al. 1999). The optical counterpart of RX J0806.3+1527 has been identified as a blue (V ~ 21.1 mag/B ~ 20.7 mag) object with a ~15 per cent (pulsed fraction) pulsation at the same period, which leads the X-ray pulsation by Δφ ~ 0.2 cycles (Israel et al. 2002; Ramsay et al. 2002; Barros et al. 2007). X-ray and optical monitoring of RX J0806.3+1527 have shown that its period is decreasing at a rate of about 1 ms per year (about − 4 × 10-11 s s-1; see Israel et al. 2004; Strohmayer 2003, 2005; Hakala et al. 2004; Barros et al. 2007). No stable periodicities other than the 321.5-s one (and its harmonics) have been observed in this source.
The properties of RX J0806.3+1527 and its “twin” RX J1914.4+2456 (V407 Vul), which displays a 569-s (9.5-min) modulation and overall similar X-ray and optical properties, are interpreted in the framework of a double-degenerate binary that hosts two interacting white dwarfs (WDs), where the observed pulsation is due to orbital motion (see Cropper et al. 2004; Solheim 2010 for reviews). Roelofs et al. (2010) showed in RX J0806.3+1527 a clear modulation of He emission lines in both radial velocity and amplitude on the 5.4-min period (see also Mason et al. 2010). This confirmed that RX J0806.3+1527 is a double-degenerate system and the binary with the shortest known orbital period. As such, it is expected to be a strong source of gravitational waves (GWs), which will be detectable with GW space observatories (e.g. Nelemans 2013).
Several models have been proposed for RX J0806.3+1527 and RX J1914.4+2456. Among these, mass transfer from a Roche-lobe-filling WD to either a magnetic (polar-like) or a non-magnetic (Algol-like) accretor have been proposed. In the latter model, also known as a ‘direct impact’ accretion model (Nelemans et al. 2001; Marsh & Steeghs 2002), which assumes a light companion (~0.14 M⊙), a disk would not form since the minimum distance from the centre of the donor is smaller than the size of the accretor, resulting in the stream directly hitting the surface of the accreting WD. The former scenario (Cropper et al. 1998) is similar to that of polars, where the magnetic field of the accreting WD inhibits the formation of a disk and matter reaches the magnetic polar cap. Models invoking accretion predict, quite generically, orbital widening for two degenerate WDs, in contrast to what is observed in RX J0806.3+1527 and RX J1914.4+2456. Possible solutions to this difficulty have been proposed (Deloye & Taam 2006; D’Antona et al. 2006; Kaplan et al. 2012) but also radically different scenarios were elaborated to solve the issue.
The main alternative to accretion models involves a magnetic primary WD and a (non-magnetic) secondary that does not fill its Roche lobe; if the spin period of the primary is not synchronous with the orbital period, then the secondary crosses the primary’s magnetic field as it moves along the orbit, and the resulting electromotive force drives an electric current between the two WDs (assuming the presence of ionised material between them), whose dissipation heats the polar caps on the primary. This model, analogous to that proposed for the Jupiter–Io system, is known as the “unipolar inductor” (UI) or “electric star” model (Wu et al. 2002; Wu 2009; Dall’Osso et al. 2006, 2007; Israel & Dall’Osso 2009). Recently, Lai (2012) highlighted a critical inefficiency of this mechanism in dissipating enough energy to match the X-ray emission of the ultracompact double-WD binaries. Adopting different (but realistic) values for the relevant parameters, this can be partially relieved, although still the model might need some significant improvement beyond the current simple picture (this is discussed in more detail in Sect. 3).
Here we report on the results obtained from the analysis of a series of observations of RX J0806.3+1527 carried out with the X-ray Telescope (XRT) and the Ultra-Violet/Optical Telescope (UVOT) on board the Swift satellite. These observations allowed us to detect RX J0806.3+1527 in the near-ultraviolet (UV) and to perform a timing study simultaneously at X-ray and UV wavelengths.
2. Observations and data analysis
The Swift/XRT (Burrows et al. 2005) uses a front-illuminated CCD detector sensitive to photons between 0.2 and 10 keV. Two main readout modes are available: photon counting (PC) and windowed timing (WT). The PC mode provides two dimensional imaging information and a 2.507-s time resolution. In WT mode only one-dimensional imaging is preserved, achieving a time resolution of 1.766 ms. The Swift/UVOT (Roming et al. 2005) is a 30-cm modified Ritchey-Chrétien reflector coupled to a microchannel-plate intensified CCD detector; the set of filters covers the range 1700–6000 Å. The UVOT operates in two data-taking modes. In image mode, the counts are accumulated into an image and only the start and stop times of the exposure are recorded. In event mode, the temporal and positional information of each photon are saved. In this way, the photons can still be stacked into images, but the data can also be used to investigate variability at short time-scales (the timing resolution is equal to the readout time, 11.0322 ms for the full CCD).
From 2005 September to 2008 September, Swift observed RX J0806.3+1527 nine times. Since most observations were carried out with the 2600-Å UVOT uvw1 filter (33 ks) to further extend the study of RX J0806.3+1527 to short wavelengths, we performed additional observations with the 1928-Å uvw2 filter in March–April 2010 for a comparable exposure time (26 ks). A summary of the datasets used for this work is given in Table 1. The XRT and UVOT data were processed and filtered with standard procedures and quality cuts1 using ftools tasks in the heasoft software package (v. 6.11) and the calibration files in the 2012-02-06 caldb release.
Journal of the Swift observations of RX J0806.3+1527.
2.1. X-ray telescope spectroscopy
RX J0806.3+1527 is clearly detected up to ~1 keV in every XRT exposure but we only considered PC data, given the relatively low count rate (about 0.025 counts s-1), which have an intrinsically higher signal-to-noise ratio with respect to the WT ones. We selected the source events within a 20-pixel radius (1 XRT pixel ≃ 2.36 arcsec), while the background was estimated from an annular region with radii 50 and 80 pixels. For the spectral analysis, we combined the datasets since all count rates were consistent (χ2 probability of constancy: 98.9%), and extracted a cumulative spectrum. This resulted in a total exposure of ~57.9 ks and about 1440 ± 40 net counts in the 0.3–1 keV range. The data were grouped so as to have a minimum of 20 counts per energy bin and fed into the xspec fitting package (v. 12.7). The ancillary response file was generated with xrtmkarf, and it accounts for different extraction regions, vignetting and point-spread function corrections.
Previous studies indicate that the X-ray flux of RX J0806.3+1527 is moderately variable on long time-scales (≈30%), apart from the 5.4-min modulation, and that its spectrum is consistent with an absorbed blackbody (BB; e.g. Israel et al. 2004; Strohmayer 2005, 2008), so we fit this model to the data [ for 29 degrees of freedom (d.o.f.)]. The absorption column is NH = (1.8 ± 1.3) × 1020 cm-2, and the inferred temperature corresponds to kT = (64 ± 3) eV (here and in the following all uncertainties are at a 1σ confidence level). The 0.3–1 keV average observed flux is
  erg cm-2 s-1. The corresponding unabsorbed flux is
  erg cm-2 s-1.
2.2. Ultraviolet/optical telescope photometry
The analysis was performed (for each filter) on the stacked images from the whole campaign with the uvotsource task, which calculates the magnitude through aperture photometry within a circular region and applies specific corrections due to the detector characteristics. All magnitudes are in the natural UVOT photometric system (Vega, see Poole et al. 2008 for more details and Breeveld et al. 2010, 2011 for the most updated zero-points and count-rate-to-flux conversion factors). Since RX J0806.3+1527 is a relatively faint source in the UVOT range, we adopted an extraction radius of 3 arcsec and applied the corresponding aperture corrections2.
The UVOT exposures with the optical filter v (central wavelength 5468 Å, FWHM 769 Å; see Table 1) yielded no detection of RX J0806.3+1527 with a limit v > 20.7 mag (total exposure: 2.7 ks). In the b filter (central wavelength 4392 Å, FWHM 975 Å), the source is marginally detected (3.5σ significance) at b = (21.0 ± 0.3) mag (total exposure: 2.5 ks). Both values are consistent with past measurements from various ground-based telescopes (Israel et al. 2002; Ramsay et al. 2002).
Most of the UVOT exposures were, however, taken with the near-UV uvw1 (32.7 ks) and uvw2 (25.6 ks) filters, where the source was detected at higher than 70σ and 100σ confidence levels, respectively. The observed apparent magnitude in the uvw1 band (central wavelength 2600 Å, FWHM 693 Å) is uvw1 = (18.50 ± 0.08) mag, including a systematic error of ±0.03 mag for uncertainties in the photometric zero point and flux conversion factor. This translates into a flux density of (1.6 ± 0.1) × 10-16 erg cm-2 s-1 Å-1. We used the relation by Predehl & Schmitt (1995) to derive the optical extinction from the measured NH and we find AV = 0.10 ± 0.07 mag. We note that this value is consistent with the total line-of-sight optical extinction AV = 0.094 mag that is estimated from background infrared (IR) emission (Schlegel et al. 1998). Using the extinction curves by Fitzpatrick & Massa (2007), we obtained a de-reddened flux density  erg cm-2 s-1 Å-1. We followed the same procedure for the uvw2 data (central wavelength 1928 Å, FWHM 657 Å). The observed magnitude is uvw2 = 18.02 ± 0.09 mag (including a ±0.03 mag systematic uncertainty), which corresponds to a flux density of (3.3 ± 0.3) × 10-16 erg cm-2 s-1 Å-1. After correcting for the appropriate extinction, the de-reddened density of flux is
  erg cm-2 s-1 Å-1.
2.3. Timing analysis
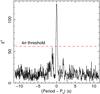 |
Fig. 1 Rayleigh periodogram for the UVOT/uvw1 light curves; the offset P0 is the period measured in the simultaneous XRT data. The 321.5-s modulation is clearly detected (see text for details). The 4σ threshold is also reported (dashed line). |
For the timing analysis, the photon arrival times were corrected to the Solar system barycentre with the barycorr task and using the Chandra source position ( ,
,  , epoch J2000;
  accurate), as provided by Israel et al. (2003). For UVOT, we could only use the time-tagged event-mode data, and for XRT, we used only the PC data (see Table 1).
With an X-ray pulsed fraction of ~100 per cent, the signal at ~321.5 s is easily detected in every XRT dataset with a long-enough exposure. By means of these new X-ray datasets, we were able to refine our previous coherent timing solution (Israel et al. 2004, 2005; Israel & Dall’Osso 2009). According to our analysis, the phase-coherent best inferred X-ray period and period derivative are P = 321.5303822(13) s and Ṗ = −3.6718(13) × 10-11 s s-1; MJD = 52619.0000 (TDB time) was used as reference epoch for the period derivative.
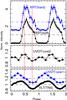 |
Fig. 2 Pulse profiles of RX J0806.3+1527 (from top to bottom) in the X-rays (upper panel; XRT for E > 0.4 keV, blue, and E < 0.4 keV), UVOT/uvw2 (middle panel), UVOT/uvw1 (blue) and optical VLT/TNG (lower panel) data. For each profile, the dashed or dot-dashed line indicates the normalized average intensity. Note that the hard XRT and UVOT/uvw1 profiles are shifted for display purposes. |
We performed a search for coherent modulations around the X-ray period in the UVOT/uvw1 data by means of a Rayleigh periodogram. Figure 1 shows the result of the search: a significant peak, about 9σ for 103 trial periods, is clearly detected in the periodogram, which testifies to the presence of a strong modulation at a period of 321.44 ± 0.15 s (1σ c.l.). This is consistent with that detected in the simultaneous X-ray dataset. A similar result was obtained for the UVOT/uvw2 dataset, though the peak significance is much lower than in the uvw1 filter, as it ranges from about 4σ to 5.5σ. The former value was found by performing a search over 103 trial periods (covering approximately a ±10-s period interval around the X-ray value) and the latter focused the search in a narrow period interval around the UVOT/uvw1 peak and assumed the Ṗ value from the updated timing solution (one independent trial). The resulting background-subtracted X-ray and UV Swift total light curves folded on the update phase-coherent solution are shown in Fig. 2 with the VLT and Telescopio Nazionale Galileo (TNG, La Palma) optical one (Israel et al. 2005). The reduction of the optical data have been carried out following the recipe outlined in Israel et al. (2002, 2004, 2005).
The pulsed fraction, defined as the semi-amplitude of the sinusoidal modulation divided by the mean source count rate, is (13 ± 2) per cent in the uvw1 band. In contrast to the X-rays (where there is no detected emission for roughly half of the period and the pulse shape has a marked “saw-tooth profile”), the optical profile is almost sinusoidal. The uvw1 pulse shape is intermediate: while less dramatic than the X-ray one, it is not purely sinusoidal. The addition of a second harmonic gives a Fisher-test chance probability of ~4 × 10⁻³, which denotes that the additional harmonic is significant at the 2.9σ confidence level.
A substantial phase shift between the XRT and uvw1 optical profiles is also evident in our results. To accurately determine the value of this shift, the uvw1 and X-ray pulse profiles were cross correlated, and the resulting peak in the cross-correlation function was fitted with a Gaussian. This yielded a phase lag of Δφ = 0.28 ± 0.02 with the X-ray peak following the uvw1 one. When considering only the separation between the maxima of the uvw1 and X-ray folded profile, we obtain a value of the phase lag Δφ = 0.20 ± 0.03 (note, however, that this measurement is more dependent on the binning). We stress that no issues related to absolute phase alignment affect the results of this analysis, since all times are assigned with the same spacecraft clock. We repeated the analysis for the VLT/TNG optical data and found that the optical and uvw1 pulsations are virtually coincident (Δφ < 0.05).
The 321.5-s modulation appears to be fainter in the uvw2 dataset with a pulsed fraction of about (7.4 ± 1.2) per cent and a double-peak shape. Interestingly, the highest peak appears almost in phase with the X-ray emission at a variance with both the optical data and the UVOT data in the uvw1 filter. On the other hand, the main minimum is approximately coincident with the minima in the uvw1 and optical bands, thus hinting at a fundamental connection between them.
3. Discussion and conclusions
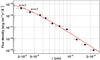 |
Fig. 3 Blackbody fit to the infrared-to-ultraviolet spectral energy distribution of RX J0806.3+1527. The new Swift UV points are labelled with the filter designation. |
The optical-to-IR spectral energy distribution (SED) of RX J0806.3+1527 can be described by a simple Rayleigh–Jeans approximation. With the Swift UV points, the blackbody signature and peak location become clearer (see Fig. 3), allowing us to derive reasonably constrained normalization and temperature (T ≃ (27 ± 8) × 103 K).
A couple of interesting implications follow. The first is that the UV-to-IR SED is well fit by a single blackbody, which suggests that one single component dominates the continuum emission, or, in other words, that the bulk of the UV continuum comes from the same thermal component seen in the optical. It is straightforward to associate this component with the hot surface of the primary WD at a temperature of ~27 000 K. The second is that, given this interpretation and the mass range of the primary determined independently in previous studies, the source distance obtained from the blackbody normalization for a primary with radius3 of ~6500 km is D ≃ 0.9 ± 0.2 (R8/6.5) kpc (where R8 is the primary radius in units of 108 cm). At this distance, the primary WD can be an important source of irradiation for the secondary with a bolometric (mostly optical) luminosity of ≈1.5 × 1032(R8/6.5)2 erg s-1, where half of is directed towards the companion. This is comparable to the X-ray luminosity of the hot spot, LX, bol ≈ 5 × 1032(R8/6.5)2 erg s-1 (see Sect. 2.1).
Besides the intrinsic shape differences, the uvw1 and optical modulations are well in phase, suggesting a common origin that we identify with the emission from the surface of the secondary, which is heated by irradiation from the hot primary. The uvw1 and optical peaks precede the X-ray modulation by 0.2 or 0.3 in phase if adopting, respectively, the emission peak shifts or the results of the cross-correlation algorithm (see Fig. 2). Therefore, the X-ray-emitting hot spot on the primary surface, responsible for the “saw-tooth” profile of the X-ray pulsations, leads by 0.2/0.3 cycles the line joining the centers of the two stars.
Whether or not the X-ray emitting hot spot on the primary is also irradiating the secondary depends on its location on the primary surface (and on possible beaming effects). According to the cross-correlation, the angle between the direction connecting the two WDs and the hot spot is 80° ± 8°, or possibly 100° ± 10° if only the offset between the emission peaks is considered. Although the two values are formally compatible, their implications are very different: the smaller value would allow slightly more than half of the secondary face to be irradiated, while the larger value would prevent X-ray irradiation. The result obtained through the cross-correlation essentially agrees with the findings of Roelofs et al. (2010), where an angle of about 70° for the hot spot was suggested. This is based on the location of an He ii line emitting bright spot in the Doppler tomogram. On the other hand, the phase shift between the emission peaks in the two bands agrees with the conclusions of Barros et al. (2007), who found that the hot spot should lead the line of the centres by more than 90° in the direction of the orbital motion. Being based on a more robust measure of the phase-shift, we tend to prefer the former case (no X-ray irradiation from the hot spot) but more observational data are required to better assess this issue.
While direct impact models naturally predict a phase offset between the impact (X-ray-emitting) spot and the line joining the centers, the observation that optical and X-ray emission have nearly the same offset in the RX J0806.3+1527 and RX J1914.4+2456, despite the significantly different orbital periods, orbital separations, and WD masses, requires some degree of fine-tuning. This is well seen from Fig. 8 in Barros et al. (2007), where the allowed range in parameter space for both systems is shown to be very narrow.
Another challenge for accretion-based models comes from the X-ray luminosity, which we estimated at ~5 × 1032(R8/6.5)2 erg s-1 (see below). The X-ray luminosity could be shifted upwards to LX, bol ≃ 1033 erg s-1 (hence, D ≃ (1.3 ± 0.3) kpc) if we assume the lightest possible primary (0.55 M⊙, cf. Note 3). We conclude that the source luminosity can hardly exceed 1033 erg s-1. The models with mass transfer that are able to explain the orbital shrinkage of RX J0806.3+1527 (and of RX J1914.4+2456) are developed by D’Antona et al. (2006), Deloye & Taam (2006) and, more recently, Kaplan et al. (2012). They all require for RX J0806.3+1527 a luminosity greater than 1033 erg s-1 and more likely of the order of 1034 erg s-1. For example, orbital shrinkage in the model by Deloye & Taam (2006) is explained if both systems are in a transient phase during which Roche-lobe overflow has ‘just’ started hence, the growing mass transfer rate has not yet reached the value required to balance GW emission. For this phase to be sufficiently long-lived, though, the model requires a relatively large accretion rate, which translates to X-ray luminosities above 1033–1034 erg s-1 for both systems (cf. Deloye & Taam 2006; Deloye et al. 2007; see also Figs. 4 and 5 in Kaplan et al. 2012; and Sect. 3 in D’Antona et al. 2006).
In these accretion-based scenarios, some fine tuning of the stellar parameters would also be required for RX J1914.4+2456 to have a larger mass transfer, hence luminosity, given its significantly longer orbital period compared to RX J0806.3+1527. D’Antona et al. (2006) stressed that their model has difficulties in explaining the properties of RX J1914.4+2456 (end of their Sect. 3) and postponed further refinements to future investigations. Finally, it is surprising within accretion scenarios that no systems are detected with an orbital period between 5 and 10 min but with widening orbits. These would be the descendents of systems like RX J0806.3+1527. By having a larger luminosity and being in a longer-lived phase of mass tansfer than RX J0806.3+1527, they should be overabundant. (Considering the small sample of objects like RX J0806.3+1527, it is, however, difficult to estimate how many such systems should exist and be observable in the Galaxy.)
A phase offset would also be expected in the UI model, which is contrary to what is often asserted, due to the bending of the flux tube caused by the massive flow of currents. Indeed, even on Jupiter, the Io footprint leads the position of the satellite by ~13° (Goldreich & Lynden-Bell 1969). A maximally bent flux tube (cf. Lai 2012) would reach the primary at approximately 90° ahead of the line joining the centers, which might explain the similar phase offset in both systems as determined by the saturation of the electric circuit.
Independent of this, a general efficiency limit of the UI model was recently discussed by Lai (2012). For double WD binaries, this translates into a maximum luminosity (Lai 2012): 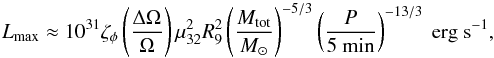 (1)where ζφ depends on the degree of bending of the flux tube (ζφ = 1 for a maximally bended tube), ΔΩ is the difference between the orbital frequency (Ω) and the primary spin frequency, μ is the magnetic moment of the primary, R is the secondary radius, Mtot the total mass of the system, and QX stands for a quantity Q in units of 10X. This represents the major problem of the UI model in its current form, since the mechanism cannot provide the required power for the X-ray luminosity of both sources and the mismatch is significant (although smaller than in the conclusions of Lai 2012, where an extreme value was assumed for the X-ray luminosity of RX J1914.4+2456). However, the idealized picture of a DC circuit in the UI model likely needs substantial revision. For instance, if the space between the WDs were not filled with sufficient particles, charge carriers would be stripped from the WD surface and accelerated along field lines. In this case, a radically different physical description would be required (cf. Alfvén 1958, 1986) and the limit of Eq. (1) might not apply. Modelling of this scenario is clearly beyond our scope here, but this is a promising direction into which the model should be extended.
See http://swift.gsfc.nasa.gov/docs/swift/analysis/ for more details.
The adopted radius of ~6500 km assumes a primary mass ~0.8 M⊙ (Nauenberg 1972), which is close to the minimum required in the direct impact model (see Fig. 8 in Barros et al. 2007). The system mass ratio was recently constrained by Roelofs et al. (2010) to q = 0.50 ± 0.13, allowing for a lighter primary, M1 ≃ 0.55 M⊙ if the orbital evolution were driven only by GW emission. However, the mechanism responsible for the X-ray emission might well affect the orbital evolution, and the allowed range of q does not give a stringent constraint on the primary mass. This latter estimate should thus be taken with caution.
Acknowledgments
This research is based on observations with the NASA/UKSA/ASI mission Swift. We also used ESO/VLT and the INAF/TNG data. S.D. acknowledges support from the SFB/Transregio 7, funded by the Deutsche Forschungsgemeinschaft (DFG). We thank the anonymous referee for constructive comments.
References
- Alfvén, H. 1958, Tellus, 10, 104 [NASA ADS] [CrossRef] [Google Scholar]
- Alfvén, H. 1986, IEEE Transactions on Plasma Science, 14, 779 [NASA ADS] [CrossRef] [Google Scholar]
- Barros, S. C. C., Marsh, T. R., Dhillon, V. S., et al. 2007, MNRAS, 374, 1334 [NASA ADS] [CrossRef] [Google Scholar]
- Breeveld, A. A., Curran, P. A., Hoversten, E. A., et al. 2010, MNRAS, 406, 1687 [NASA ADS] [Google Scholar]
- Breeveld, A. A., Landsman, W., Holland, S. T., et al. 2011, in Gamma Ray Bursts 2010, eds. J. E. McEnery, J. L. Racusin, & N. Gehrels, AIP Conf. Proc., 1358, 373 [Google Scholar]
- Burrows, D. N., Hill, J. E., Nousek, J. A., et al. 2005, Space Sci. Rev., 120, 165 [NASA ADS] [CrossRef] [Google Scholar]
- Cropper, M., Harrop-Allin, M. K., Mason, K. O., et al. 1998, MNRAS, 293, L57 [NASA ADS] [CrossRef] [Google Scholar]
- Cropper, M., Ramsay, G., Wu, K., & Hakala, P. 2004, in IAU Colloq. 190: Magnetic Cataclysmic Variables, eds. S. Vrielmann, & M. Cropper (San Francisco: ASP), ASP Conf. Proc., 315, 324 [Google Scholar]
- D’Antona, F., Ventura, P., Burderi, L., & Teodorescu, A. 2006, ApJ, 653, 1429 [NASA ADS] [CrossRef] [Google Scholar]
- Dall’Osso, S., Israel, G. L., & Stella, L. 2006, A&A, 447, 785 [NASA ADS] [CrossRef] [EDP Sciences] [Google Scholar]
- Dall’Osso, S., Israel, G. L., & Stella, L. 2007, A&A, 464, 417 [NASA ADS] [CrossRef] [EDP Sciences] [Google Scholar]
- Deloye, C. J., & Taam, R. E. 2006, ApJ, 649, L99 [NASA ADS] [CrossRef] [Google Scholar]
- Deloye, C. J., Taam, R. E., Winisdoerffer, C., & Chabrier, G. 2007, MNRAS, 381, 525 [NASA ADS] [CrossRef] [Google Scholar]
- Fitzpatrick, E. L., & Massa, D. 2007, ApJ, 663, 320 [NASA ADS] [CrossRef] [EDP Sciences] [Google Scholar]
- Goldreich, P., & Lynden-Bell, D. 1969, ApJ, 156, 59 [NASA ADS] [CrossRef] [Google Scholar]
- Hakala, P., Ramsay, G., & Byckling, K. 2004, MNRAS, 353, 453 [NASA ADS] [CrossRef] [Google Scholar]
- Israel, G. L., & Dall’Osso, S. 2009, in Physics of Relativistic Objects in Compact Binaries: From Birth to Coalescence, eds. M. Colpi, P. Casella, V. Gorini, U. Moschella, & A. Possenti(Dordrecht: Springer), Astrophys. Space Sci. Lib., 359, 281 [Google Scholar]
- Israel, G. L., Panzera, M. R., Campana, S., et al. 1999, A&A, 349, L1 [NASA ADS] [Google Scholar]
- Israel, G. L., Hummel, W., Covino, S., et al. 2002, A&A, 386, L13 [NASA ADS] [CrossRef] [EDP Sciences] [Google Scholar]
- Israel, G. L., Covino, S., Stella, L., et al. 2003, ApJ, 598, 492 [NASA ADS] [CrossRef] [Google Scholar]
- Israel, G. L., Covino, S., Dall’Osso, S., et al. 2004, Mem. Soc. Astron. It. Suppl., 5, 148 [Google Scholar]
- Israel, G. L., dall’Osso, S., Mangano, V., et al. 2005, in Interacting Binaries: Accretion, Evolution, and Outcomes, eds. L. Burderi, L. A. Antonelli, F. D’Antona, et al., AIP Conf. Proc., 797, 307 [Google Scholar]
- Kaplan, D. L., Bildsten, L., & Steinfadt, J. D. R. 2012, ApJ, 758, 64 [NASA ADS] [CrossRef] [Google Scholar]
- Lai, D. 2012, ApJ, 757, L3 [NASA ADS] [CrossRef] [Google Scholar]
- Marsh, T. R., & Steeghs, D. 2002, MNRAS, 331, L7 [NASA ADS] [CrossRef] [Google Scholar]
- Mason, E., Israel, G. L., Dall’Osso, S., et al. 2010, unpublished [arXiv:astro-ph/1003.1986] [Google Scholar]
- Nauenberg, M. 1972, ApJ, 175, 417 [NASA ADS] [CrossRef] [Google Scholar]
- Nelemans, G. 2013, in The 9th LISA Symposium, eds. G. Auger, P. Binétruy, & E. Plagnol (San Francisco: ASP), ASP Conf. Ser., 467, 27 [Google Scholar]
- Nelemans, G., Portegies Zwart, S. F., Verbunt, F., & Yungelson, L. R. 2001, A&A, 368, 939 [NASA ADS] [CrossRef] [EDP Sciences] [Google Scholar]
- Poole, T. S., Breeveld, A. A., Page, M. J., et al. 2008, MNRAS, 383, 627 [NASA ADS] [CrossRef] [Google Scholar]
- Predehl, P., & Schmitt, J. H. M. M. 1995, A&A, 293, 889 [NASA ADS] [Google Scholar]
- Ramsay, G., Hakala, P., & Cropper, M. 2002, MNRAS, 332, L7 [NASA ADS] [CrossRef] [Google Scholar]
- Roelofs, G. H. A., Rau, A., Marsh, T. R., et al. 2010, ApJ, 711, L138 [NASA ADS] [CrossRef] [Google Scholar]
- Roming, P. W. A., Kennedy, T. E., Mason, K. O., et al. 2005, Space Sci. Rev., 120, 95 [NASA ADS] [CrossRef] [Google Scholar]
- Schlegel, D. J., Finkbeiner, D. P., & Davis, M. 1998, ApJ, 500, 525 [NASA ADS] [CrossRef] [Google Scholar]
- Solheim, J.-E. 2010, PASP, 122, 1133 [NASA ADS] [CrossRef] [Google Scholar]
- Strohmayer, T. E. 2003, ApJ, 593, L39 [NASA ADS] [CrossRef] [Google Scholar]
- Strohmayer, T. E. 2005, ApJ, 627, 920 [NASA ADS] [CrossRef] [Google Scholar]
- Strohmayer, T. E. 2008, ApJ, 679, L109 [NASA ADS] [CrossRef] [Google Scholar]
- Wu, K. 2009, RA&A, 9, 725 [CrossRef] [Google Scholar]
- Wu, K., Cropper, M., Ramsay, G., & Sekiguchi, K. 2002, MNRAS, 331, 221 [NASA ADS] [CrossRef] [Google Scholar]
All Tables
All Figures
|
Fig. 1 Rayleigh periodogram for the UVOT/uvw1 light curves; the offset P0 is the period measured in the simultaneous XRT data. The 321.5-s modulation is clearly detected (see text for details). The 4σ threshold is also reported (dashed line). |
| In the text | |
|
Fig. 2 Pulse profiles of RX J0806.3+1527 (from top to bottom) in the X-rays (upper panel; XRT for E > 0.4 keV, blue, and E < 0.4 keV), UVOT/uvw2 (middle panel), UVOT/uvw1 (blue) and optical VLT/TNG (lower panel) data. For each profile, the dashed or dot-dashed line indicates the normalized average intensity. Note that the hard XRT and UVOT/uvw1 profiles are shifted for display purposes. |
| In the text | |
|
Fig. 3 Blackbody fit to the infrared-to-ultraviolet spectral energy distribution of RX J0806.3+1527. The new Swift UV points are labelled with the filter designation. |
| In the text | |
Current usage metrics show cumulative count of Article Views (full-text article views including HTML views, PDF and ePub downloads, according to the available data) and Abstracts Views on Vision4Press platform.
Data correspond to usage on the plateform after 2015. The current usage metrics is available 48-96 hours after online publication and is updated daily on week days.
Initial download of the metrics may take a while.