Fig. 2
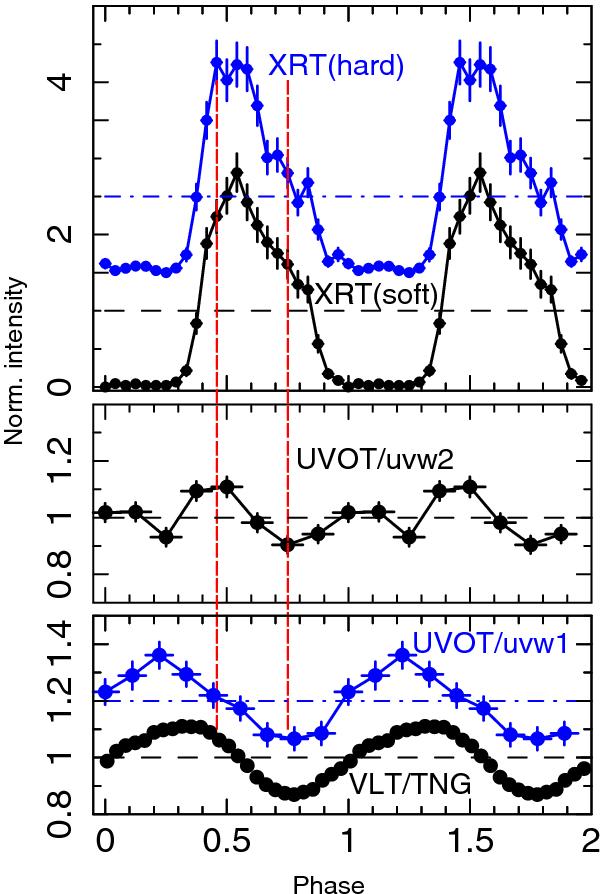
Pulse profiles of RX J0806.3+1527 (from top to bottom) in the X-rays (upper panel; XRT for E > 0.4 keV, blue, and E < 0.4 keV), UVOT/uvw2 (middle panel), UVOT/uvw1 (blue) and optical VLT/TNG (lower panel) data. For each profile, the dashed or dot-dashed line indicates the normalized average intensity. Note that the hard XRT and UVOT/uvw1 profiles are shifted for display purposes.
Current usage metrics show cumulative count of Article Views (full-text article views including HTML views, PDF and ePub downloads, according to the available data) and Abstracts Views on Vision4Press platform.
Data correspond to usage on the plateform after 2015. The current usage metrics is available 48-96 hours after online publication and is updated daily on week days.
Initial download of the metrics may take a while.