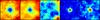
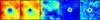
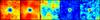
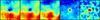
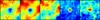
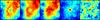
Fig. 1
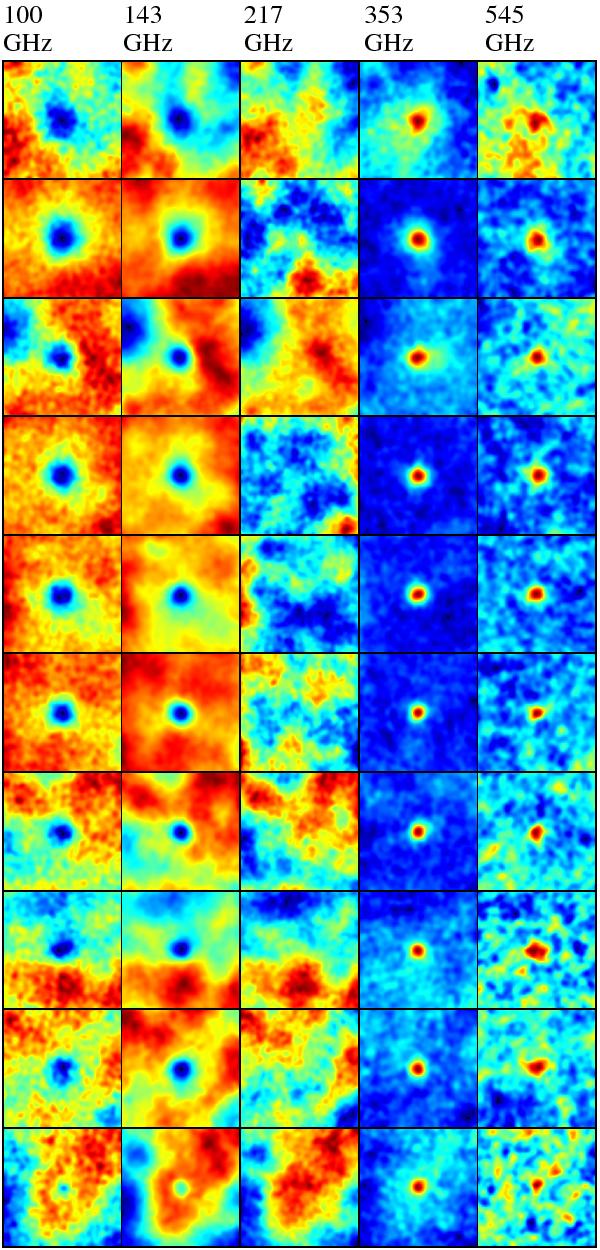
From left to right: stack of Planck intensity maps from 100 to 545 GHz cleaned by the 857 GHz channel, centered on the location of Planck tSZ detected clusters. From top to bottom: stacked signal from tSZ detected clusters in different redshifts bins (from z = 0.0 to z = 0.5), see Table 4 for the redshift bins. Each stacked map represents an area of 2° × 2°.

Current usage metrics show cumulative count of Article Views (full-text article views including HTML views, PDF and ePub downloads, according to the available data) and Abstracts Views on Vision4Press platform.
Data correspond to usage on the plateform after 2015. The current usage metrics is available 48-96 hours after online publication and is updated daily on week days.
Initial download of the metrics may take a while.