Fig. 6
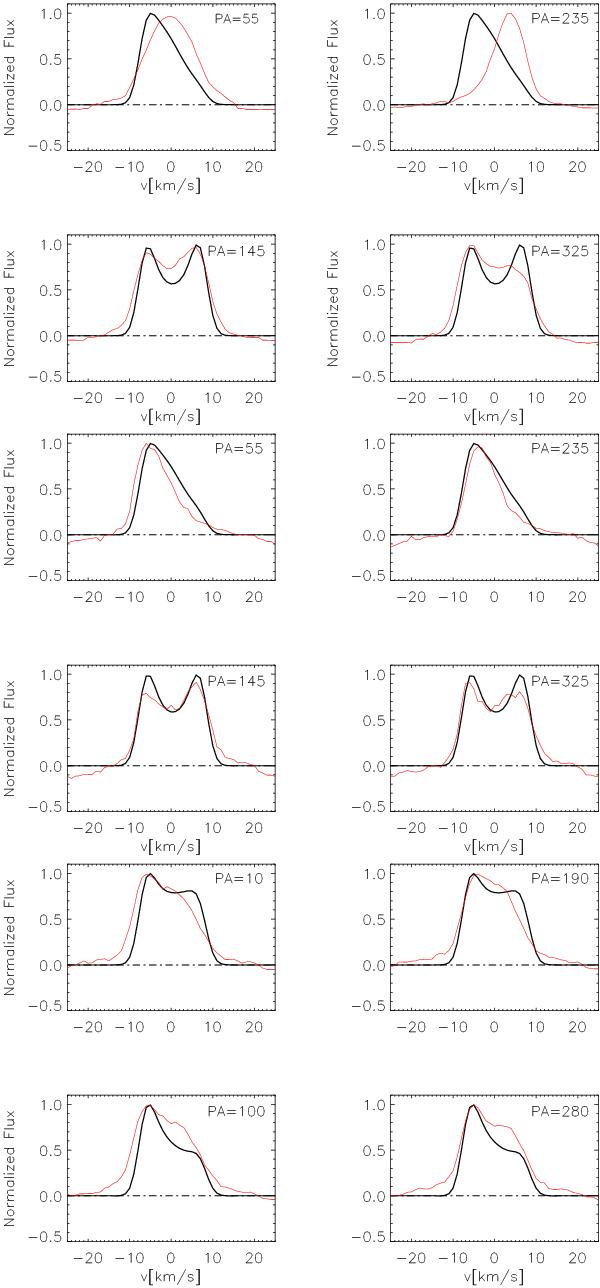
The top four panels are the average modelled and slit filtered
comparison of the line sample collected on the 29th at PA = 55/145/235/325, the
middle four panels are the average modelled and slit filtered
comparison of the line sample collected on the 30th at PA = 55/145/235/325 and the
bottom four panels are the average modelled and slit filtered
comparison of the line sample collected on the 30th at PA = 10/100/190/280. For all
frames the pointing offset was 0 6. The black
lines are the median of all the individual modelled transistion lines (The
individual lines are all quite similar and the median therefore looks almost
identical to the individual lines). The red lines are the average observed line
profile (described in Sect. 4). The sample of
lines plotted and used for the average are those listed in Table 2.
6. The black
lines are the median of all the individual modelled transistion lines (The
individual lines are all quite similar and the median therefore looks almost
identical to the individual lines). The red lines are the average observed line
profile (described in Sect. 4). The sample of
lines plotted and used for the average are those listed in Table 2.
Current usage metrics show cumulative count of Article Views (full-text article views including HTML views, PDF and ePub downloads, according to the available data) and Abstracts Views on Vision4Press platform.
Data correspond to usage on the plateform after 2015. The current usage metrics is available 48-96 hours after online publication and is updated daily on week days.
Initial download of the metrics may take a while.