Fig. 3
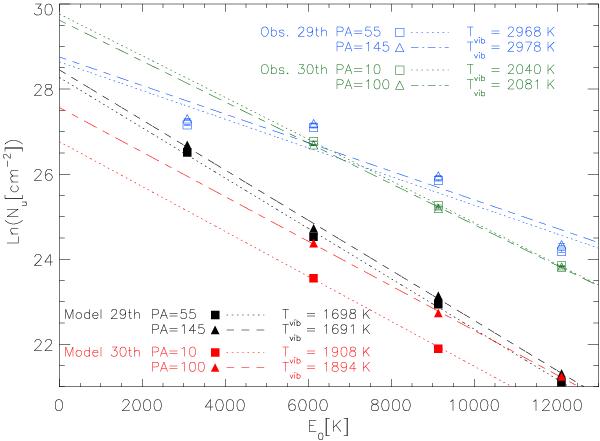
Vibrational diagram for all transitions observed on the 29th at PA = 55°/145° and on the 30th at PA = 10°/100° (the individual lines are listed in Table 2). The error bars are smaller than the plotting symbols. For PA = 10°/100° the line sample does not include any v = 1–0, transitions so the corresponding line has only been fitted from three points. The vibrational diagram from the two sets of simulated lines (different slit filter settings) from the model are are also included in the plot (derived and discussed in Sect. 5.4).
Current usage metrics show cumulative count of Article Views (full-text article views including HTML views, PDF and ePub downloads, according to the available data) and Abstracts Views on Vision4Press platform.
Data correspond to usage on the plateform after 2015. The current usage metrics is available 48-96 hours after online publication and is updated daily on week days.
Initial download of the metrics may take a while.