Fig. A.4
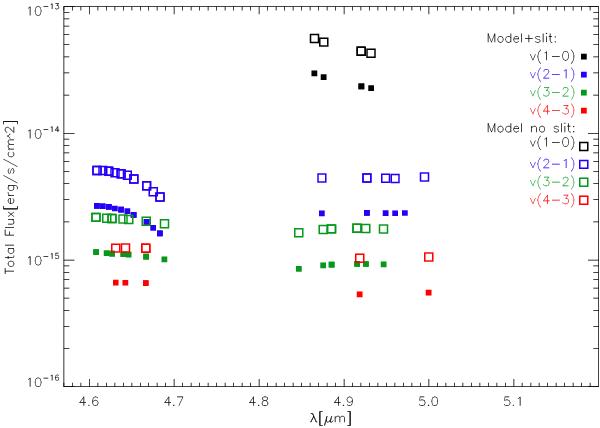
Flux versus wavelength comparing the slit filtered model to the non slit filtered model for all lines observed on the 29th at PA = 145° listed in Table 2. The slit filtered modelled fluxes are shown as diamonds and the modelled fluxes without slit filter are shown as stars. The different vibrational bands are colour coded: v = 1–0 is black, v = 2–1 is blue, v = 3–2 is green and v = 4–3 is red.
Current usage metrics show cumulative count of Article Views (full-text article views including HTML views, PDF and ePub downloads, according to the available data) and Abstracts Views on Vision4Press platform.
Data correspond to usage on the plateform after 2015. The current usage metrics is available 48-96 hours after online publication and is updated daily on week days.
Initial download of the metrics may take a while.