Fig. A.2
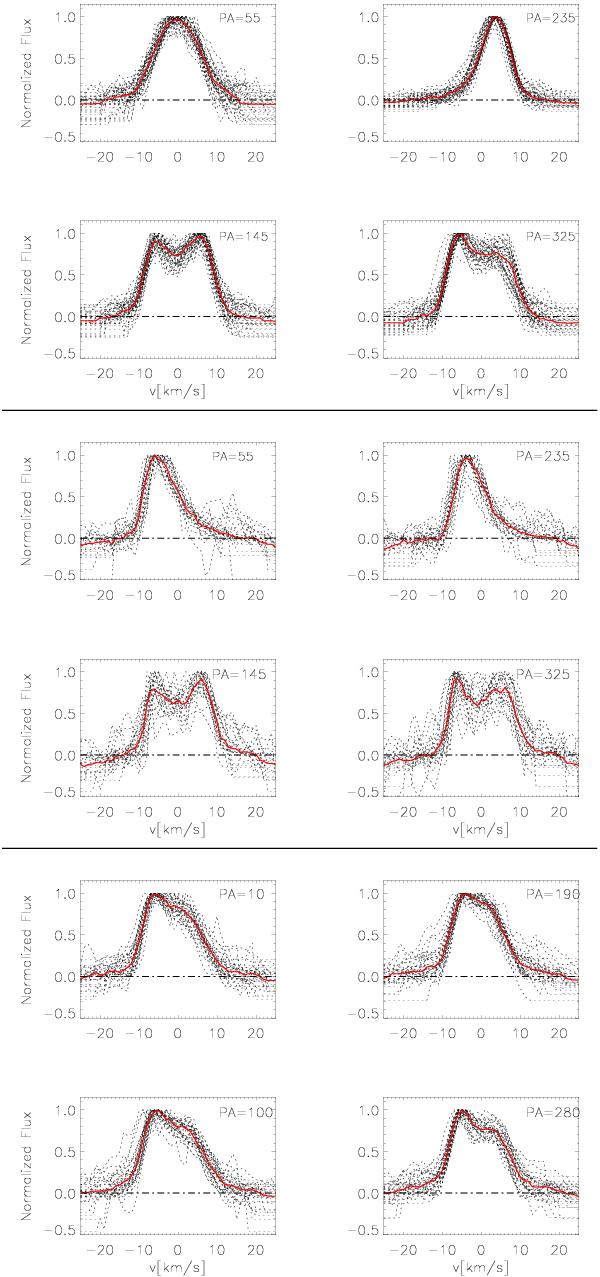
Averaged line profiles at eight different position angles containing transitions from all v-levels observed on the 29th and 30th, listed in Table 2. The dotted lines are the normalized individual transitions and the red line is the median of all these lines. The upper four panels show the line profiles collected at PA = 55°/145°/235°/325° on the 29th. The middle four panels show the line profiles collected at PA = 55°/145°/235°/325° on the 30th. The lower four panels show the line profiles collected at PA = 10°/100°/190°/280° on the 30th.
Current usage metrics show cumulative count of Article Views (full-text article views including HTML views, PDF and ePub downloads, according to the available data) and Abstracts Views on Vision4Press platform.
Data correspond to usage on the plateform after 2015. The current usage metrics is available 48-96 hours after online publication and is updated daily on week days.
Initial download of the metrics may take a while.