Fig. A.1
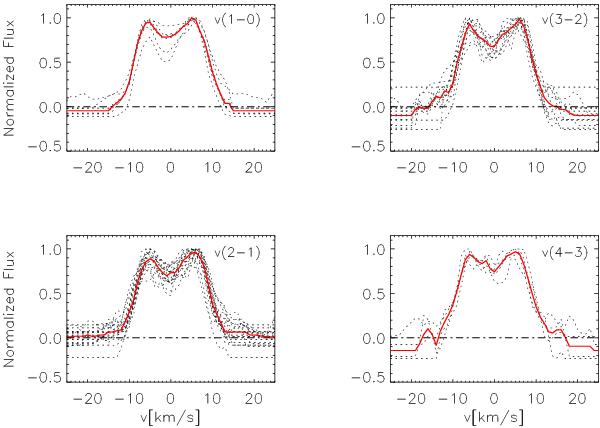
Averaged line profile at PA = 145° for lines observed on the 29th, for each v level separately. The lines included are those listed in Table 2. The dotted lines are the normalized individual transitions and the red line is the median average of all these lines.
Current usage metrics show cumulative count of Article Views (full-text article views including HTML views, PDF and ePub downloads, according to the available data) and Abstracts Views on Vision4Press platform.
Data correspond to usage on the plateform after 2015. The current usage metrics is available 48-96 hours after online publication and is updated daily on week days.
Initial download of the metrics may take a while.