Fig. 4
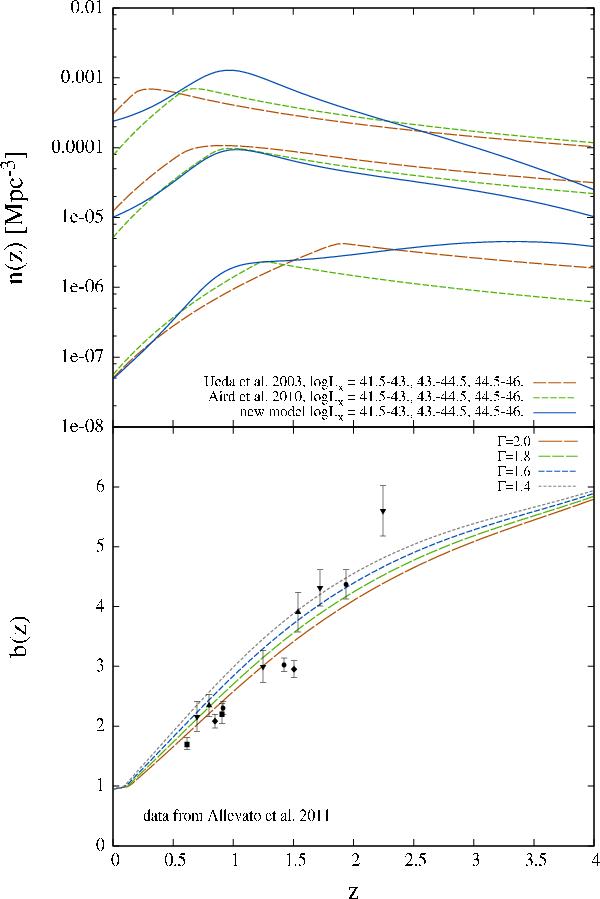
Upper panel: comoving X-ray AGN number densities as a function of redshift for three 2 − 10 keV band luminosity ranges as shown in the legend. The luminosity is increasing from top to bottom. Along with our constrained Model II we have also plotted the results arising from the LF models of Ueda et al. (2003) and Aird et al. (2010). Lower panel: comparison of bias parameters from the constrained Model II with the observational data from Allevato et al. (2011). The four lines assume different effective photon indices (Γ = 1.4,1.6,1.8,2.0) for the approximate transformation between soft and hard X-ray bands.
Current usage metrics show cumulative count of Article Views (full-text article views including HTML views, PDF and ePub downloads, according to the available data) and Abstracts Views on Vision4Press platform.
Data correspond to usage on the plateform after 2015. The current usage metrics is available 48-96 hours after online publication and is updated daily on week days.
Initial download of the metrics may take a while.