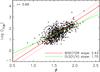
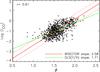
Fig. 15
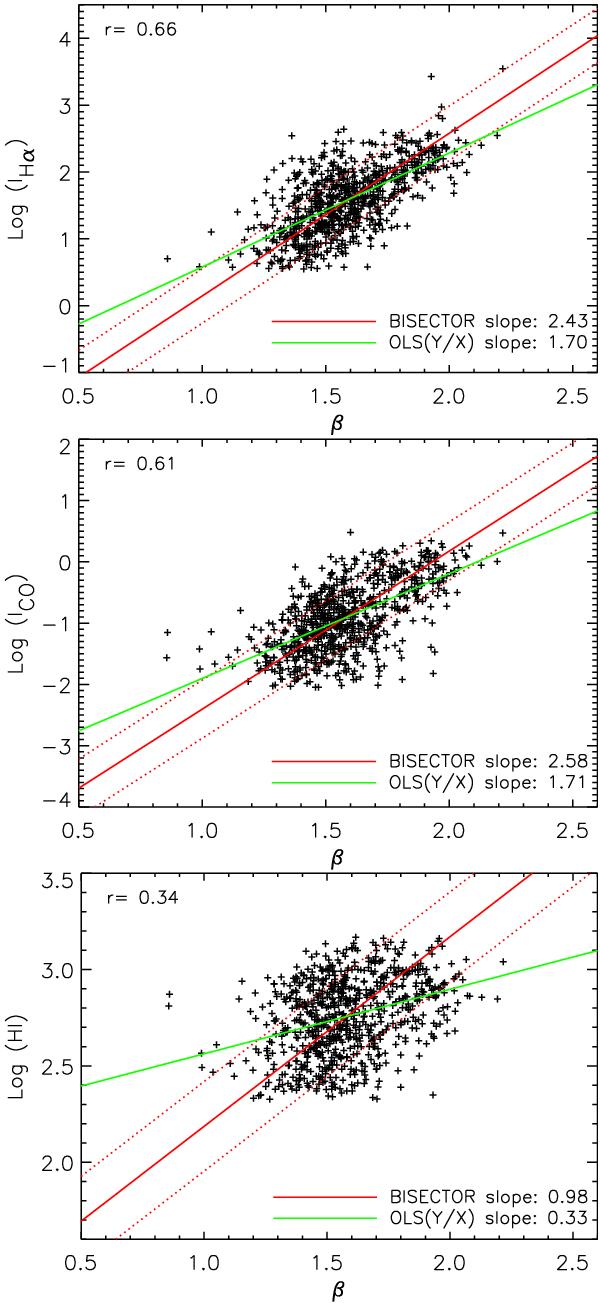
Scatter plots of the dust emissivity index β versus the Hα, CO(1 − 0), and HI emission from M 33. The y-axis presents the logarithm of the intensities in units of cm-6 pc for the Hα emission and K km s-1 for the CO(1 − 0) and HI emssions. Also shown are Pearson correlation coefficients (r), the ordinary least-squares (OLS) fits, and the bisector fits.
Current usage metrics show cumulative count of Article Views (full-text article views including HTML views, PDF and ePub downloads, according to the available data) and Abstracts Views on Vision4Press platform.
Data correspond to usage on the plateform after 2015. The current usage metrics is available 48-96 hours after online publication and is updated daily on week days.
Initial download of the metrics may take a while.