Free Access
Fig. 7
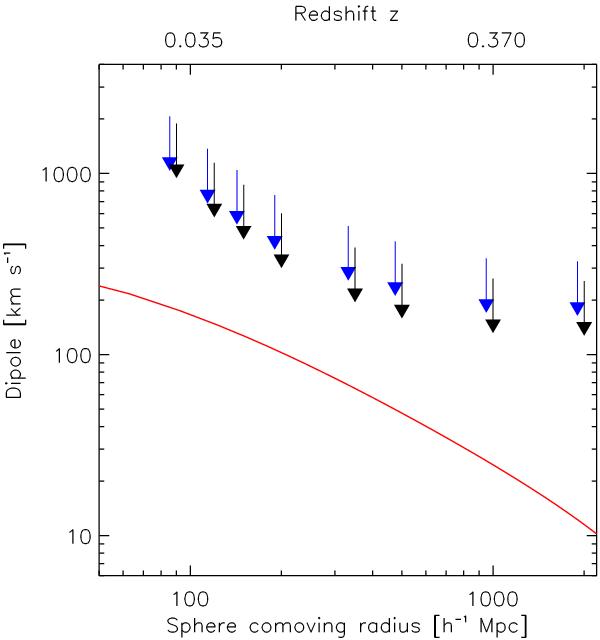
Upper limits at the 95% confidence level for the dipole amplitude from MCXC clusters contained in local spheres of varying radii. Blue and black arrows denote limits for AP and uMMF methods, respectively. The upper limits are indicated by the tails of the arrows. The solid red line depicts the ΛCDM prediction.
Current usage metrics show cumulative count of Article Views (full-text article views including HTML views, PDF and ePub downloads, according to the available data) and Abstracts Views on Vision4Press platform.
Data correspond to usage on the plateform after 2015. The current usage metrics is available 48-96 hours after online publication and is updated daily on week days.
Initial download of the metrics may take a while.