Fig. 6
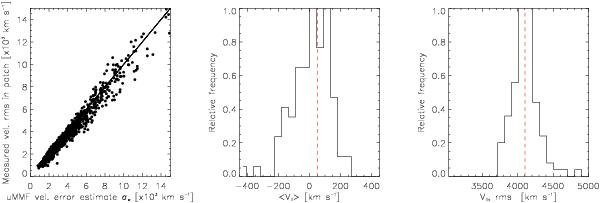
Left panel: estimated rms of uMMF outputs at 100 random positions within the patch surrounding each MCXC cluster versus the corresponding peculiar velocity error as predicted by the uMMF. Middle panel: histogram of mean kSZ radial velocity estimated using all un-masked MCXC clusters, for the 101 positions considered in each cluster patch. The vertical, dashed red line corresponds to the average kSZ estimate when averaging throughout the patch centres, i.e., at the real cluster positions. Right panel: uMMF velocity rms histogram obtained for the MCXC cluster set, at different positions within the patches, just as for the middle panel. Again, the vertical dashed red line corresponds to the kSZ velocity rms estimated at real cluster positions (on patch centres).
Current usage metrics show cumulative count of Article Views (full-text article views including HTML views, PDF and ePub downloads, according to the available data) and Abstracts Views on Vision4Press platform.
Data correspond to usage on the plateform after 2015. The current usage metrics is available 48-96 hours after online publication and is updated daily on week days.
Initial download of the metrics may take a while.