Free Access
Fig. 12
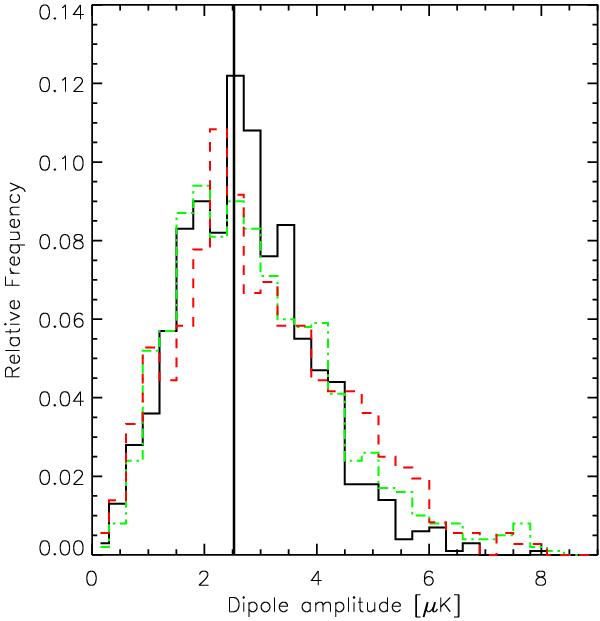
Same as Fig. 11, but restricting the analysis to the 200 most massive clusters outside the mask. The colour and line-style coding is identical to that figure. In this case, all histograms contain the measurement on the real positions of clusters (displayed by the vertical solid line).
Current usage metrics show cumulative count of Article Views (full-text article views including HTML views, PDF and ePub downloads, according to the available data) and Abstracts Views on Vision4Press platform.
Data correspond to usage on the plateform after 2015. The current usage metrics is available 48-96 hours after online publication and is updated daily on week days.
Initial download of the metrics may take a while.