Fig. 11
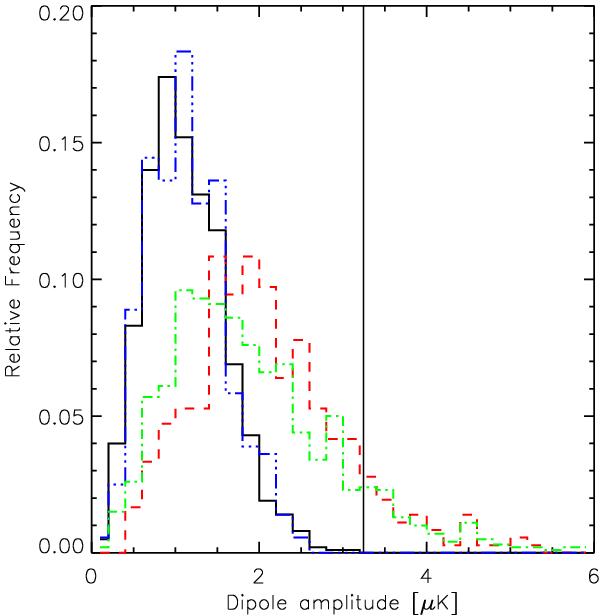
Histograms of the recovered cluster dipole amplitude: (a) from the 1000 Monte Carlo random cluster configurations on the sky (solid black line); (b) from rotating one random cluster configuration in Galactic latitude on the real filtered map (triple dot-dashed blue line); (c) from rotating the real MCXC cluster configuration around the Galactic z axis on the real filtered map (dashed red line); and (d) from applying the filter on the position of our MCXC cluster sample in 1000 Monte Carlo CMB simulations following the WMAP-7 best-fit model (dot-dashed green lines). The dipole amplitude recovered at the real MCXC cluster positions on the real filtered map is shown by the vertical, solid line. It is not significantly detected, provided one is careful to simulate the most important noise contributions.
Current usage metrics show cumulative count of Article Views (full-text article views including HTML views, PDF and ePub downloads, according to the available data) and Abstracts Views on Vision4Press platform.
Data correspond to usage on the plateform after 2015. The current usage metrics is available 48-96 hours after online publication and is updated daily on week days.
Initial download of the metrics may take a while.