Fig. 10
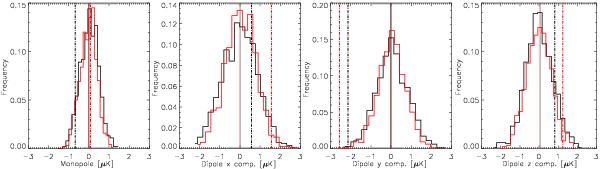
Monopole and dipole component estimates after applying the spatial filter of Kashlinsky et al. (2008) on WMAP-7 W-band data (black lines) and on Planck 2D-ILC maps (red lines). Estimates from real MCXC clusters are displayed by vertical, dot-dashed lines. Histograms are obtained after repeating the analysis on 1000 random cluster configurations, with averages indicated by the vertical, solid lines. The y-component appears discrepant here, but compare with Fig. 11.
Current usage metrics show cumulative count of Article Views (full-text article views including HTML views, PDF and ePub downloads, according to the available data) and Abstracts Views on Vision4Press platform.
Data correspond to usage on the plateform after 2015. The current usage metrics is available 48-96 hours after online publication and is updated daily on week days.
Initial download of the metrics may take a while.