| Issue |
A&A
Volume 561, January 2014
|
|
|---|---|---|
| Article Number | A119 | |
| Number of page(s) | 14 | |
| Section | Galactic structure, stellar clusters and populations | |
| DOI | https://doi.org/10.1051/0004-6361/201220802 | |
| Published online | 21 January 2014 | |
Investigating potential planetary nebula/cluster pairs⋆,⋆⋆,⋆⋆⋆
1 Departamento de AstronomíaUniversidad de Concepción, Casilla 160-C, Concepción, Chile
e-mail: This email address is being protected from spambots. You need JavaScript enabled to view it.
2 Instituto de Astronomía, Universidad Católica del Norte, Av. Angamos 0610, Casilla 1280, Antofagasta, Chile
3 Halifax, Nova Scotia, B3K 5L3, Canada
4 Departamento de Astronomia, Universidade Federal do Rio Grande do Sul, Av. Bento Gonçalves 9500, 91501-970, RS, Porto Alegre Brazil
5 Department of Astronomy and Physics, Saint Mary’s University, Halifax, NS B3H 3C3, Canada
6 Departamento de Física y Astronomía, Facultad de Ciencias, Universidad de Valparaíso, Av. Gran Bretaña 1111, Casilla 5030, Valparaíso, Chile
7 Departamento de Astronomía y Astrofísica, Pontificia Universidad Católica de Chile, Casilla 306, Santiago, Chile
8 Vatican Observatory, V 00120 Vatican City State, Italy
9 ESO – European Southern Observatory, Avda Alonso de Cordova, 3107, Casilla 19001, 8370134 Santiago, Chile
10 Dipartimento di Fisica e Astronomia, Universitá di Padova, via Marzolo 8, 35131 Padova, Italy
Received: 28 November 2012
Accepted: 3 November 2013
Abstract
Context. Fundamental parameters characterizing the end-state of intermediate-mass stars may be constrained by discovering planetary nebulae (PNe) in open clusters (OCs). Cluster membership may be exploited to establish the distance, luminosity, age, and physical size for PNe, and the intrinsic luminosity and mass of its central star.
Aims. Four potential PN-OC associations were investigated to assess the cluster membership for the PNe.
Methods. Radial velocities were measured from intermediate-resolution optical spectra, complemented with previous estimates in the literature. When the radial velocity study supported the PN/OC association, we analyzed whether other parameters (e.g., age, distance, reddening, central star brightness) were consistent with this conclusion.
Results. Our measurements imply that the PNe VBe 3 and HeFa 1 are not members of the OCs NGC 5999 and NGC 6067, respectively, and that they very likely belong to the background bulge population. Conversely, consistent radial velocities indicate that NGC 2452/NGC 2453 could be associated, but our results are not conclusive so additional observations are warranted. Finally, we demonstrate that all the available information point to He 2-86 being a young, highly internally obscured PN member of NGC 4463. New near-infrared photometry acquired via the Vista Variables in the Via Lactea ESO public survey was used in tandem with existing UBV photometry to measure the distance, reddening, and age of NGC 4463, finding d = 1.55 ± 0.10 kpc, E(B − V) = 0.41 ± 0.02, and τ = 65 ± 10 Myr, respectively. The same values should be adopted for the PN if the proposed cluster membership is confirmed.
Key words: planetary nebulae: general / open clusters and associations: general
Based on observations gathered with ESO-VISTA telescope (program ID 172.B-2002).
Based on observations gathered at Las Campanas observatory (program ID CN2012A-080).
The spectra as FITS files are only available at the CDS via anonymous ftp to cdsarc.u-strasbg.fr (130.79.128.5) or via http://cdsarc.u-strasbg.fr/viz-bin/qcat?J/A+A/561/A119
© ESO, 2014
1. Introduction
Our knowledge of the intrinsic properties of the Galactic planetary nebulae (PNe) has been restricted in part by large uncertainties tied to their distance estimates, accurate only within 35% to 50% on average (Zhang 1995). That unsatisfactory uncertainty is confirmed by Fig. 6 in Giammanco et al. (2011), who find significant (random and systematic) offsets between the latest IPHAS extinction distances for PNe and existing estimates. The impetus for discovering PNe in open clusters (OCs) is thus clear, because well-studied OCs possessing solid spectroscopic observations and deep multi-band photometry may yield distance uncertainties less than 10% (e.g., Majaess et al. 2012; Chené et al. 2012). PNe in OCs will always be a rare phenomenon representing only a tiny fraction of the ~3000 known Galactic PNe, but they may be subsequently employed as crucial calibrators for methods used to establish PNe distances (Bensby & Lundström 2001; Osterbrock & Ferland 2006; Frew & Parker 2006).
Establishing cluster membership for PNe offers a potential means of determining their fundamental properties. A PN’s true dimensions and age can be deduced from cluster membership, given the availability of an apparent angular diameter and expansion velocity for the object. Moreover, main-sequence progenitor masses for PNe may be constrained by examining cluster members near the turnoff. Unfortunately, detection of an association between a PN and an OC is hampered by numerous factors, including the short lifetimes of PNe. For example, for a Galactic OC exhibiting an age of 100 Myr, the main-sequence mass for the PN progenitor is ~4 M⊙, which implies a PN phase that lasts for merely ~103 years. In general, that lifetime is sensitive to the progenitor mass and mass loss along the red giant branch (see, e.g., Schönberner & Blöcker 1996), and typically ranges from 103 to 105 years (Schönberner & Blöcker 1996; Köppen & Acker 2000). Jacob et al. (2013) have recently proposed that the typical visibility time of PN is only ~20 000 years. Furthermore, the rapid dissolution rate of OCs ensures that a significant fraction of OCs capable of housing a PN have dissolved by the time they are old enough to produce one (Battinelli & Capuzzo-Dolcetta 1991; Lada & Lada 2003; de la Fuente Marcos & de la Fuente Marcos 2008). Younger OCs exhibiting ages less than ~30 Myr are probably excluded because their evolved stars are believed to terminate as Type-II supernovae. Moreover, Larsen & Richtler (2006) detected only three PNe in their sample of eighty extragalactic OCs, an occurrence a factor of two lower than expected. They suggest that the discrepancy could be due, among other factors, to uncertainties in PN lifetimes.
Majaess et al. (2007) discuss the possible cluster membership of thirteen PNe. Chance coincidences were found to exist for seven of the cases considered, but the authors advocated follow-up studies for at least six PN/OC pairs in which a physical association was not excluded by the available evidence, namely M 1-80/Berkeley 57, NGC 2438/NGC 2437, NGC 2452/NGC 2453, VBRC 2 and NGC 2899/IC 2488, and HeFa 1/NGC 6067. Majaess et al. (2007) likewise tabulated a number of additional potential associations between PNe and OCs, which included G305.3−03.1/Andrews-Lindsay 1 (ESO 96−SC04) and He 2-86/NGC 4463.
Numerous studies have since been published that have advanced the field and helped clarify the situation concerning several potential PN/OC associations. A follow-up study by Kiss et al. (2008) contradicted the previous results of Pauls & Kohoutek (1996), concluding that AAOmega radial velocities (RVs) rule out membership for NGC 2438 in NGC 2437, since an offset of ~30 km s-1 exists between the objects. Bonatto et al. (2008) reports the discovery of a new OC (designated Bica 6) and proposed that it hosts the PN Abell 8, on the basis of parameters inferred from Two Micron All Sky Survey (2MASS, Skrutskie et al. 2006) near-infrared color–magnitude diagrams (CMDs), and stellar radial density profiles. Turner et al. (2011) subsequently obtained CCD spectra, UBVRIC photometry, and RVs for luminous cluster stars in Bica 6 to complement the Bonatto et al. (2008) analysis, and reaffirmed that the PN is a cluster member.
Parker et al. (2011) secured new RVs for the PN G305.3–03.1 (PHR 1315–6555, Parker et al. 2006) and members of Andrews-Lindsay 1. By comparing the cluster and PN parameters, they demonstrate that all available evidence points to a physical association between the objects. However, the distance estimates for that heavily reddened faint cluster vary from 7.57 kpc (Phelps et al. 1994) to 16.9 kpc (Carraro et al. 2005). The sizable dust extinction along the line of sight to Andrews-Lindsay 1 was most likely a contributing factor that hindered the establishment of a precise cluster distance, especially since existing results are mainly tied to optical observations. Additional observations are desirable for determining the cluster distance with better accuracy so as to eventually take advantage of the proven cluster membership to study the PN properties in detail.
A close apparent spatial coincidence is clearly only a first step toward identifying physically related PN/OC pairs. A common RV is also required, as an additional, necessary but not sufficient condition. Ideally, the independently measured distance and reddening of both the PN and OC, in addition to RVs, should show a good match to prove their association beyond doubt. Unfortunately, as already discussed, the distance estimates of most PNe are based on statistical methods that are not particularly reliable for a single object. As a consequence, the literature values are often uncertain, and very discrepant (see, for example, the case of He 2-86 discussed in Table 5). On the other hand, the reddening of a PN must be used with caution, since PNe could suffer from non-negligible internal dust extinction. This is still a controversial point in the literature. For example, Gathier et al. (1986) claim that internal reddening of PNe rarely exceeds 0.05 mag, while Zagury (2005) suggests that 0.1–0.2 mag could be common, and much higher values can be found in a few cases. Phillips (1998) also argues that internal dust opacity in younger nebulae is often appreciable. Thus, a comparison of all the PN and OC parameters can be far from straightforward.
This study constitutes the first in an extensive project undertaken to assess membership for PNe lying in close apparent angular proximity to OCs. Four potential PN/OC pairs are investigated in this study, namely VBe 3(G326.1−01.9)/NGC 5999, HeFa 1(G329.5−02.2)/NGC 6067, NGC 2452/NGC 2453, and He 2-86(G300.7−02.0)/NGC 4463. Aware that many proposed associations are actually chance alignments, we preliminarily measured RVs on intermediate-resolution spectra, to identify the pairs worthy of more time-consuming, follow-up investigations.
2. Spectroscopic data and measurements
Our observations targeted three OCs and three PNe of the four PN/OC pairs object of the present work. Precise RV of the PN NGC 2452 and the OC NGC 6067 have previously been measured by other authors, so we took these values from the literature.
The program stars were selected from the 2MASS catalog. The criteria for selection were the proximity to the cluster evolutionary sequence in the IR CMD, the stellar magnitude, and the distance from the cluster center. The positions of the observed stars in the CMD are indicated in Fig. 1, and their photometric data are provided in Table 2.
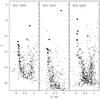 |
Fig. 1 Color–magnitude diagrams of the program clusters. The 2MASS point sources within 3′ from the cluster center are plotted as small dots. Full circles indicate the selected targets, while empty circles convey the positions of stars that entered the slit fortuitously. |
Log of the observations.
The spectra were collected on 2012 April 13 with the B&C spectrograph at the focus of the 2.5 m du Pont telescope at the Las Campanas observatory. The 1200 line/mm grating was used at the second order, with a grating angle of , thus collecting data in the spectral interval 5960–6660 Å. This range was selected to target various features suitable for inferring RV measurements in the spectra of hot stars, red giants, and PNe. In fact, the spectral range could not be changed during observations owing to the non-repeatability of the exact grating angle position. The slit width was adjusted to the instrumental anamorphic demagnification (Schweizer 1979) to have a 2.5-pixel resolution of 0.85 Å on the CCD. The corresponding projected width on the sky was  . All the selected targets, both stars and nebulae, were centered on the slit and in the same position along the spatial direction, to avoid systematics between the measurements. This point is particularly relevant for PNe, whose off-center RV can differ from the systemic value. During daytime operations prior to the run, we realized that focusing the instrument throughout the entire spectral range was impossible. We therefore decided to focus the redder half of the spectra, which hosts the Hα line, since this feature is suitable for inferring RV measurements for the PNe and program stars. As a consequence, the spectra was progressively de-focused toward shorter wavelengths, but the present investigation was entirely restricted to the well-focused part redward of 6300 Å.
The log of the observations is presented in Table 1. Exposure times varied between 300 s and 900 s, depending on the stellar magnitude to ensure similar signal-to-noise (S/N) quality for all targets. The exposures for the PNe were a factor of two longer and were adjusted to match the brightness of the Hα emission. Observing numerous stars in the same cluster only required minimal telescope movement, and the instrumental conditions were expected to remain comparatively stable. Consequently, a lamp frame for wavelength calibration (indicated as “wlc” in Table 1) was collected each time the telescope was moved to observe a different cluster or if a given cluster was observed longer than an hour. During data reduction, we verified that the shift between two consecutive lamp exposures was typically 1–2 km s-1, except between wlc8 and wlc9, where it reached 4 km s-1. However, the three stars observed between these lamp images do not show, within the errors, a systematic offset with respect to the other stars observed in the same cluster (NGC 5999).
The data were reduced by means of standard IRAF1 routines. The frames were debiased and flat-fielded using calibration frames acquired during daytime operations, and the one-dimensional spectra were subsequently extracted with an optimum algorithm (Horne 1986). The sky background was estimated from two adjacent regions on both sides of the stellar spectrum and subtracted. For each star, the dispersion solution was obtained with the respective lamp frame, extracted at the same position on the CCD as the science spectrum to avoid biases introduced by the curvature of the arcs. The lamp emission lines in the out-of-focus bluer half of the spectrum were double-peaked. To overcome this problem, the lamp spectrum was convolved with a Gaussian with FWHM = 10 pixels. That procedure produced well-shaped lines without altering the line centers and did not cause blending among the few well-separated features. The dispersion solution was derived with a third-order polynomial fit, and the rms of the residuals was typically ~0.023 Å, i.e. ~1.1 km s-1 at Hα. The lamp spectra were calibrated, and the position of the lamp lines was compared to laboratory wavelengths to check the final calibration solution. Finally, the spectra were normalized as required for the RV measurements. Some extracted spectra are illustrated in Fig. 2 as an example, where we show a typical spectrum for a hot target (2MASS 12294384−6448130), a cool red giant (2MASS J15521389−5628139), and the noisy spectrum of a star that fell in the spectrograph slit by chance (MSP 146). The resulting S/N for the final spectra of the selected targets was typically in the range of 20–50. The spectra of the three program PNe are displayed in Fig. 3.
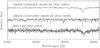 |
Fig. 2 Examples of the collected spectra. The spectra have been shifted vertically to avoid overlap. |
Non-program stars fell in the spectrograph slit in each exposure, as expected by the nature of the surveyed low-latitude crowded stellar fields near OCs. Their spectra were extracted and analyzed in a similar fashion to the main targets. Most of these objects were too faint to supply pertinent information, since the resulting measurements were highly uncertain for them. The RVs established were different from that of the cluster stars in most cases, indicating that they are probably field stars. However, the off-center position in the slit for such objects may have introduced systematic errors in the RV. The typical seeing during the run was 1″, slightly lower than the projected slit width, a fact that could have enhanced this well-known problem of slit spectroscopy (see, for example, the analysis in Moni Bidin et al. 2006). In certain cases, their position in the CMD merely confirmed their status as field stars. Still, the photometry and RV of some of these additional stars were compatible with cluster membership, and the non-members helped distinguish the cluster RV from the field in one case (Sect. 3.4). They are therefore included in our analysis and are indicated with “A” in the second column of Table 2, whereas the selected targets are marked with “T”.
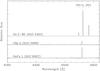 |
Fig. 3 Spectra of the target PNe. The spectra have been shifted vertically to avoid overlap, and that of He 2-86 was vertically reduced by a factor of ten. |
Radial velocities for the program stars were measured via cross-correlation (CC, Simkin 1974; Tonry & Davis 1979), as implemented in the fxcor IRAF task. The peak of the CC function was fit with a Gaussian profile. Synthetic spectra of solar metallicity drawn from the library of Coelho et al. (2005) were used as templates. Previous investigations have shown that the RV measurements are not affected by the exact choice of the template, because a partial mismatch between object and template spectral types merely enhances the formal uncertainties, without shifting the peak of the CC function (Morse et al. 1991; Moni Bidin et al. 2011b). The spectra of hot stars, which show a broad and isolated Hα feature, were cross-correlated with a spectrum with Teff = 5500 K and log g = 4.0. A cooler model with Teff = 4500 K and log g = 2.0 was adopted for the few giant stars. The latter were recognized by the narrowness of Hα and the numerous blended lines. In both cases, the CC was restricted to the range 6520–6590 Å, comprising the Hα line and wings. The CC error was in the range of 3–6 km s-1 for the well-exposed targets, while it increased to upward of 20–30 km s-1 for the fainter stars that happened to fall within the slit. As a consistency check, we measured the RV of each target again by fitting the core of the Hα line with a Gaussian profile. The accuracy of these measurements was lower, typically by a factor of two, but the mean difference with the CC results was  km s-1 with an rms of 4.3 km s-1, showing no systematic difference between our values and the results of this independent direct estimate.
Radial velocities for the PNe were measured by cross-correlating their spectrum with a synthetic Hα emission profile, convolved with a Gaussian to match the instrumental resolution of the observed spectra. The Hα emission line was always bright and well exposed. We checked that our results are consistent within 1σ with those obtained by fitting the observed lines with a Gaussian profile, although this procedure returned final errors higher by a factor of two. Additional emission lines at bluer wavelengths were visible in some cases, but they were not employed to infer the RV owing to their extreme faintness and the focus problem mentioned before. On the well-focused redder half, bright [N ii] lines at 6548 and 6583 Å were observed in the spectrum of He 2-86 in NGC 4463. No signature of the [WC4] central star was identified in the spectrum, whose features are likely to be too faint (Acker & Neiner 2003) for our data. In this case, the RV was determined from the three observed features, cross-correlating the spectrum in the range 6540–6590 Å with a synthetic template comprising both the Hα and the two [N ii] lines.
All spectra were extracted again without background subtraction. The position of the [O i] sky emission lines at 6300.0 and 6363.8 Å, measured by means of a Gaussian fit, was used to evaluate possible zero-point offsets. The resulting corrections to the measured RVs were typically on the order of −10 km s-1. That procedure was performed slightly off-center of the object spectrum in the case of PNe to avoid contamination by their emission lines. Finally, the RVs were transformed to heliocentric velocities. The results are summarized in Table 2. The errors were obtained from the quadratic sum of the relevant uncertainties affecting our procedure: the CC error, the wavelength calibration error, and the uncertainty in the zero-point correction. This last quantity typically amounted to 1–3 km s-1. The typical total error for target stars varied from 4 to 10 km s-1, except for one case.
Photometric data and radial velocities of the program objects.
3. Results
3.1. NGC 5999 and VBe 3
Previous investigations of the cluster NGC 5999 yielded consistent distances and reddenings (d ≈ 2 kpc, E(B − V) ≈ 0.45), yet the cluster age estimates exhibit a ~50% spread (Santos & Bica 1993; Piatti et al. 1999; Netopil et al. 2007). No RV measurements are available for the cluster stars. The PN VBe 3 lies ~5′ from the cluster center, which places the PN within the cluster’s coronal region (Kholopov 1969). Star counts inferred from 2MASS photometry indicate that the cluster’s domination of the field terminates near 3.5′. A more comprehensive analysis of the radial density profile is warranted (e.g., Bonatto et al. 2008), but beyond the scope of this study because, as shown later in this section, it is not required to assess the PN cluster membership. No estimates of E(B − V), distance, or RV for the PN were found in the literature.
Our observations targeted five candidate cluster members. Six additional objects fell in the slit and are included in our analysis. The weighted mean of all eleven RVs is VR = −33 ± 7 km s-1, where the uncertainty is the statistical error-on-the-mean. However, a 2σ-clipping algorithm excludes three outliers. Those stars are tagged with “2σ-clip” in the last column of Table 2. The weighted mean decreases to VR = −38 ± 6 km s-1 after their exclusion, and the change introduced by the cleaning procedure is not significant to within uncertainties. Among the selected targets, only 2MASS 15522168−5626451 is excluded by this procedure. The six additional stars exhibit larger uncertainties, and thus contribute less to the weighted mean. When only considering the selected targets with the exclusion of 2MASS 15522168−5626451, the weighted mean is VR = −39 ± 3 km s-1. That result can be considered the best estimate of the cluster RV.
The RV of the PN is VR = −157 ± 3 km s-1. To our knowledge, there are no previous estimates available in the literature, and ours is the first measurement of the RV of this nebula. The offset from the cluster value is sizable (≈15σ, defining the error on the difference as the quadratic sum of the uncertainties on the OC and PN RVs). This proves strongly that the PN is not a cluster member. The association between VBe 3 and NGC 5999 is therefore a chance alignment.
3.2. NGC 6067 and HeFa 1
NGC 6067 is important for the distance scale since it hosts the classical Cepheid V340 Nor (Eggen 1983; Turner 2010). Turner (2010) cites a cluster distance of d = 1.7 ± 0.1 kpc, identical to the Cepheid distance established by Storm et al. (2011) via the infrared surface brightness technique (Fouqué & Gieren 1997). The distance cited for PN HeFa 1 is highly uncertain, but Henize & Fairall (1983) and Tylenda et al. (1992) report a reddening of E(B − V) = 0.66. That value is much higher than the one established for V340 Nor by Turner (2010, E(B − V) = 0.29 ± 0.03. That discrepancy may indicate that the PN is an unrelated background object, but this evidence alone is not conclusive because, as discussed in Sect. 1, PNe can suffer from internal dust obscuration. The nebula is found at a large angular distance from NGC 6067 (12′), but the cluster is radially very extended. In fact, even the classical Cepheid QZ Nor at 20′ from the center is a cluster member (Majaess et al. 2013), thus HeFa 1 lies within the cluster boundaries.
Mermilliod et al. (1987) established a precise RV for the cluster, namely VR = −39.3 ± 1.6 km s-1, updated to VR = −39.99 ± 0.18 km s-1 by Mermilliod et al. (2008). Our result for the PN is VR = −141 ± 3 km s-1. As in the previous case, this estimate is new in the literature, and it differs from the cluster value by ≈18σ. As a result, the PN is not a cluster member. A physical association between the PN and the OC is therefore excluded.
Incidentally, the results for this PN/OC chance alignment closely resemble those obtained for NGC 5999 and VBe 3 (Sect. 3.1): the two OCs and PNe exhibit similar RVs (- km s-1 for the clusters, VR ≈ − 150 km s-1 for the PNe). Both pairs are projected toward the Galactic bulge (l ≈ 330°, b ≈ − 2°), separated by only . The PNe are likely members of the background bulge population (e.g., Majaess et al. 2007, their Fig. 1).
3.3. NGC 2453 and NGC 2452
Establishing a reliable distance for NGC 2453 has proved problematic because the cluster is projected along the same line of sight as the Puppis associations (Majaess et al. 2009b). The resulting CMD is thus heavily contaminated by stars at different distances and reddening. The cluster distance is known only within a factor of two, with some authors proposing d ≈ 2.4–3.5 kpc (Moffat & Fitzgerald 1974; Glushkova et al. 1997; Dambis 1999; Hasan et al. 2008), and others finding a much higher value, d ≥ 5 kpc (Mallik et al. 1995; Moitinho et al. 2006). As a consequence, the selection of our targets was not straightforward. There is agreement that the cluster reddening is approximately E(B − V) ~ 0.47–0.49, which is expected to slowly increase along this line of sight beyond d ≈ 2 kpc (Neckel et al. 1980; Gathier et al. 1986).
NGC 2452 is a massive PN (Cazetta & Maciel 2000), whose progenitor must have been an intermediate-mass main-sequence star close to the upper limit allowed for PN formation. This is consistent with the ~40 Myr age of NGC 2453 proposed by Moffat & Fitzgerald (1974) and Moitinho et al. (2006), which implies a turnoff mass of ≈7 M⊙. The nebula lies ~3.4 cluster radii (~, Moffat & Fitzgerald 1974; Mallik et al. 1995) from the center, i.e. well within the cluster corona. Depending on the cluster distance, this corresponds to a physical separation of 6–12 pc. Zhang (1995) and Tylenda et al. (1992) established parameters for the PN of d = 3.0 ± 0.4 kpc and E(B − V) = 0.36 ± 0.12, respectively. Gathier et al. (1986) proposed E(B − V) = 0.43 ± 0.05, roughly matching the cluster reddening, but they proposed a large difference between the cluster and PN distances (5 ± 0.6 and ~3.6 ± 0.6 kpc, respectively). However, the authors estimated these values from the reddening-distance relation derived along the line of sight, but the reddening of the two objects agree within only 1σ.
Our observations targeted six candidate members of NGC 2453, and RVs were likewise measured for four additional stars falling serendipitously in the slit. The weighted average of these ten measurements yielded VR = 72 ± 12 km s-1. After the exclusion of two outliers by means of a 2σ-clipping algorithm, as well as of two other highly uncertain measurements (stars MSP 190 and 2MASS J07472558−2712019), the result is VR = 72 ± 3 km s-1.
Proper motions of program stars in NGC 2453.
TYC 6548-905-1 (as first noted by MacConnell 1981) and MSP 74 (first reported by Moffat & Fitzgerald 1974) exhibit Hα emission, as indicated in the last column of Table 2. Their double-peaked asymmetric profile is not ideal for inferring RVs. In fact, these two objects have the highest RVs among the six stars analyzed. Unfortunately, no weaker features suitable for RV measurements were detectable at the resolution and S/N of our spectra in the restricted well-focused spectral range. Moreover, Moffat & Fitzgerald (1974) observed double lines in the spectrum of TYC 6548-905-1 and established VR = 67 ± 14 km s-1 for the star, which is barely compatible with our measurement despite the very large uncertainty. Mermilliod et al. (2008) measured VR = 85.24 ± 0.31 km s-1 for TYC 6548-790-1, which differs from our estimate. They do not claim that the star is RV-variable, but their four measurements are only consistent within 2.4σ. The resulting probability of RV variability is high (~93%). Finally, the proper motion of MSP 159 is offset from the other stars. The proper motions of program stars, drawn from the PPMXL catalog (Roeser et al. 2010), are given in Table 3 and overplotted in Fig. 4 to that of all stars within of the cluster center. Unfortunately, the PPMXL catalog provides no data for the stars MSP 146 and TYC 6548-905-1. The proper motions of stars near the cluster center are close to zero, as expected for this distant object. All the observed stars agree with that distribution, except MSP 159 and MSP 190, marked with “pm-nm” in the last column of Table 2. The latter object was also excluded from our analysis because of its uncertain RV.
The mean RV decreases after excluding some or all of these doubtful cluster members and can be as low as VR = 67 ± 2 km s-1 when the two emission-line objects and TYC 6548-790-1 are excluded. A change of 5 km s-1 is not large, but this uncertainty must be taken into account. After excluding all the stars whose membership or RV is uncertain for any reason, only two reliable measurements are left, whose mean velocity is VR = 68 ± 2 km s-1. Therefore, considering that different exclusion criteria lead to mean velocities in the range 67–72 km s-1, with a statistical uncertainty of 2 km s-1, we conclude that the best estimate of the cluster RV is VR = 68 ± 4 km s-1.
Previous estimates for the RV of the PN NGC 2452 have yielded VR = 62.0 ± 2.8 km s-1 (Meatheringham et al. 1988), 68.0 ± 2.5 (Wilson 1953), and 65 ± 3 km s-1 (Durand et al. 1998). The weighted mean of these results is reported in Table 2. These values agree within 1–1.5σ with our estimate for the cluster. The RV analysis therefore supports cluster membership for the PN NGC 2452 in NGC 2453. However, this result cannot be considered conclusive given the uncertainties discussed above. Additional research is desirable. In particular, a precise assessment of the cluster distance in addition to a more extensive RV study would settle the matter. We incidentally note that both NGC 2453 and the PN NGC 2452 are very young objects, and it is reasonable to assume that they partake of the Galactic rotation. With a calculation similar to the one presented in Sect. 5.3, we find that the RVs of both objects put them at about d = 6.5 kpc from the Sun.
3.4. NGC 4463 and He 2-86
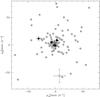 |
Fig. 4 Proper motions of stars within from the center of NGC 2453. The observed targets and additional stars are indicated with full and empty dots, respectively. |
Our observations targeted five stars in NGC 4463, and four additional objects fell into the slit. Two of our targets were previously observed by Hron et al. (1985), who measured RVs for five cluster stars. They found VR = −17.4 ± 3.0 km s-1 for CPD−64 1946, in excellent agreement with our result, whereas their measurement for HD 108719 (VR = −10.0 ± 4.6 km s-1) differs from the estimate established here. However, that peculiar object is probably a binary system, as discussed in Sect. 4.4. Another interesting star targeted by their investigation, but not by ours, is the F-type supergiant CPD−64 1943. Their result (VR = −43.9 ± 5.8 km s-1) is very different from VR = −12.2 ± 0.2 km s-1 found by Mermilliod et al. (2008). This last estimate is particularly reliable, because it is the average of five measurements at different epochs.
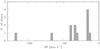 |
Fig. 5 Radial velocity distribution of the stars observed in NGC 4463. |
The RV distribution of our stars is shown in Fig. 5, which includes the results of Hron et al. (1985) for two objects not in common with us, cited in Table 2, and the measurement of Mermilliod et al. (2008) for CPD−64 1943. A group of five stars is found near VR ~ − 15 km s-1, comprising three of our selected targets, and none of the additional stars. The other stars are scattered at more negative values, but tend to be distributed between − 30 and − 40 km s-1. Half of the additional stars fall in this range. These objects have a much lower cluster membership probability, because in the CMD they lie either off the cluster sequence or in the faint part of the cluster MS (J > 12) heavily contaminated by field stars (see the field CMD of Fig. 6). In fact, as discussed in more detail in Sect. 5.3, Russeil et al. (1998) found a kinematical group in the background of the cluster with mean velocities between − 30 and − 40 km s-1. We conclude that the cluster RV is VR = −15.1 ± 0.8 km s-1. The stars found to exhibit more negative RVs are considered field background stars.
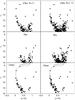 |
Fig. 6 CMDs of NGC 4463 extracted for r = 1′ (left panels) and (right). Panels show the observed (top), same-area sky (middle) and decontaminated (bottom) CMDs. A 50 Myr Padova isochrone of solar metallicity was shifted by E(J − H) = 0.13 and d⊙ = 1.54 kpc. |
The statistical uncertainty given here most probably underestimates the true error, because the RVs of four cluster stars are identical within 1 km s-1, but the uncertainty on each of these measurements is ~5 km s-1. Assuming this typical measurement error as the standard deviation in the calculation of the error-on-the-mean is probably more representative of the true uncertainty. In this way we fixed the final error as 2 km s-1.
The literature RV estimates for this cluster are summarized in Table 4. It must be noted that both Kharchenko et al. (2007) and Dias et al. (2002) used the results of Hron et al. (1985), but Kharchenko et al. (2007) obtained a lower value because they averaged all the available measurements, while Dias et al. (2002) excluded the two stars at VR ≈ − 35 km s-1. In fact, a similar distribution to the one observed in Fig. 5 can be found among the five stars of the Hron et al. (1985) sample. Mermilliod et al. (2008), in contrast, based their results solely on CPD−64 1943. The literature estimates for the RV of the PN He 2-86 are also summarized in Table 4. Our result is VR = −11 ± 4 km s-1, which agrees within 1σ with all the previous estimates. The PN RV is similar to the cluster velocity within 4 km s-1 (0.9σ), and is compatible with cluster membership within the errors.
Literature RV estimates for NGC 4463 and He 2-86.
4. Fundamental parameters for NGC 4463
The RV of He 2-86 is consistent with its membership in NGC 4463. Near-IR photometric data collected by the Vista Variables in the Via Lactea (VVV) ESO public survey may be employed to constrain the fundamental parameters of NGC 4463, to investigate the possible OC/PN connection in more detail.
The VVV survey is gathering near-IR data of the Galactic bulge and adjacent regions of the disk (Minniti et al. 2010; Catelan et al. 2011). The central regions of the Milky Way are being surveyed four magnitudes deeper than 2MASS, with excellent image quality and scale (FWHM < 1″, 0.34″/pix, Saito et al. 2010). Sizable extinction may shift a significant fraction of the main-sequence near/beyond the limiting magnitude of existing shallow surveys, thereby complicating the efforts to apply isochrones and infer the cluster distance. Precise JHKs observations for stellar clusters are consequently pertinent since obscuration by dust is less significant in the infrared. The VVV database is therefore ideal for studying obscured stellar clusters in the Galactic disk (Majaess et al. 2012; Chené et al. 2012).
The age (τ) and distance of NGC 4463 are not well constrained in the literature. Kharchenko et al. (2005) obtained d = 1.05 kpc and log τ = 7.97, whereas the WEBDA web site2 (Mermilliod 1996; Mermilliod & Paunzen 2003) cites log τ = 7.505 and Moffat & Vogt (1973) finds d = 1.24 kpc. Establishing the parameters of this cluster using new and deep VVV JHKs photometry is thus desirable.
4.1. VVV data and PSF-fitting photometry
NGC 4463 is found in the VVV tile d005 (see Saito et al. 2012, for a description of VVV data, and the definition of VVV tiles and pawprints). We retrieved from the Vista Science Archive website (VSA)3 the stacked pawprints (single 16-chip images) of this tile, collected in the five bands YZJHKs, plus five additional epochs in Ks. The data were acquired between February and April 2010 using the VIRCAM camera, which is mounted on the VISTA 4 m telescope at Paranal Observatory (Emerson & Sutherland 2010). The frames were pre-reduced (debiased, flat-fielded, sky-subtracted, and stacked) at the Cambridge Astronomical Survey Unit (CASU)4 with the VIRCAM pipeline v1.0 (Irwin et al. 2004). The weather conditions were optimal during the observations and fell within the survey’s constraints for seeing, airmass, and Moon distance (Minniti et al. 2010).
Stellar PSF-fitting photometry was performed with the VVV-SkZ-pipeline (Mauro et al. 2013), automated software based on DAOPHOT iv (Stetson 1987) and ALLFRAME (Stetson 1994) that is optimized for extracting PSF photometry from VVV images. We fed the pipeline all the single 2048 × 2048 pixel frames collected on chip #4 of the VIRCAM array, for a resulting ~20 × 20′ field. A total of sixty images were used, i.e. six frames in each of the five bands and in each of the additional five epochs collected in the Ks band. The JHKs instrumental magnitudes were calibrated using 2MASS standards, following the procedure described by Chené et al. (2012) and Moni Bidin et al. (2011a). The YZ magnitudes were not calibrated owing to the lack of available standard stars in the field, and they will not be used in our study.
4.2. Field-star decontaminated VVV CMDs
Mitigating field-star contamination will facilitate an analysis of the CMDs. Field contamination is expected in low Galactic latitude fields, such as the one hosting NGC 4463. For this purpose we applied the statistical field-star decontamination algorithm developed by Bonatto & Bica (2007), adapted to exploit the VVV photometric depth in J, H, and Ks (Bonatto & Bica 2010; Borissova et al. 2011; Chené et al. 2012). We combined several regions around NGC 4463 to build the comparison field, which maximizes the statistical representation of the field stars.
CMDs extracted within r = 1′ and of cluster center are shown in the top panels of Fig. 6, where a typical star cluster sequence detaches from the field contamination (middle panels). Finally, the end products of the decontamination algorithm are the clean CMDs (bottom) in which most of the contaminant stars have been removed. The clean CMDs are adequately fitted by a Padova isochrone (Girardi et al. 2000) of solar metallicity and an age of 50 Myr (with an uncertainty of ±10 Myr). Additional parameters for the isochrone setting are the apparent distance modulus (m − M)J = 11.3 ± 0.1, and the foreground reddening E(J − H) = 0.13 ± 0.01 that, with Cardelli et al. (1989) reddening relations, converts to E(B − V) = 0.42 ± 0.03 and AV = 1.29 ± 0.10. Taken together, these parameters imply a distance of d = 1.54 ± 0.07 kpc for NGC 4463.
4.3. Reddening and distance
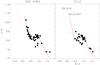 |
Fig. 7 Optical color-color diagrams for stars lying within of the center of NGC 4463 (left panel) and in the surrounding field (, right panel). Overplotted is the intrinsic relation of Turner (1989) (dashed curve), and that relation shifted by E(B − V) = 0.42 (solid curve). |
Our first estimate of the cluster reddening and distance based on IR photometry was checked and refined by complementing the VVV data with the optical UBV data of Delgado et al. (2007, 2011). As shown in Fig. 7, a UBV color–color diagram for stars from the core is populated by objects typical of the field (i.e., later-type objects), whereas objects within are dominated by cluster B-stars. The intrinsic UBV relation of Turner (1989, and references therein) was shifted along a reddening slope of EU − B/EB − V = 0.72 + 0.02 × EB − V (Turner 1976), to infer the reddening from stars lying within of the cluster center. The resulting mean color excess is E(B − V) = 0.41 ± 0.02, which agrees with our estimate based on VVV data.
The cluster distance may be established by means of multi-band CMDs, for the reddening previously determined and shifting an intrinsic relation along the ordinate to match the target data. An empirical JHKs main-sequence calibration established from deep 2MASS photometry and revised Hipparcos parallaxes for nearby stars is employed (Majaess et al. 2011c). That infrared calibration is comparatively insensitive to stellar age and metallicity, and it is anchored to seven benchmark OCs that exhibit matching JHKs and revised Hipparcos distances (van Leeuwen 2009). The objective is to avoid deriving distances using a single benchmark cluster (i.e., the Pleiades), thus potentially introducing a possibly large systematic uncertainty. By employing seven benchmark clusters and shifting to the infrared where metallicity effects are mitigated, that problem was avoided. For example, the Hipparcos parallax for the Pleiades corresponds to a distance of d = 120.2 ± 1.9 pc (van Leeuwen 2009), whereas HST observations imply d = 134.6 ± 3.1 pc (Soderblom et al. 2005; see also Majaess et al. 2011c, and discussion therein).
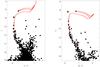 |
Fig. 8 IR and optical CMDs for stars within from the center of NGC 4463. The curves indicate the isochrone described in the text. The empty circle highlights the position of the star HD 108719. |
The JH and BV CMDs for stars from the cluster center are shown in Fig. 8. The VVV data were supplemented by 2MASS photometry for the brightest stars saturated on the VVV images. The resulting distance to the cluster is d = 1.55 ± 0.10 kpc, for a ratio of total to selective extinction RJ = AJ/E(J − H) = 2.75 (Majaess et al. 2011a).
4.4. CPD−64 1943 and HD 108719
The cluster age proved more difficult to constrain than its distance, since any application of an isochrone is acutely sensitive to the inclusion of the two brightest stars: CPD−64 1943 and HD 108719. We therefore start by discussing them in more detail.
CPD-64 1943 was classified by Fitzgerald et al. (1979) as F5 Iab. Mermilliod et al. (2008) measured a radial velocity VR = −12.2 ± 0.2 km s-1 for this star, consistent with that established for the PN and the cluster mean. Mermilliod et al. (2008) do not indicate that the star is RV variable, but the measurement of Hron et al. (1985) is noticeably different (− 43.9 ± 5.8 km s-1).
HD 108719 is the hottest star observed in the cluster area and, as such, its membership would strongly constrain the cluster age. It is located at only ~3″ from the nominal cluster center. The initial mass function implies that early-type stars are rare in a given field, and it is thus improbable from that perspective that the star is not a cluster member. However, such an early-type star (spectral type B1, see below) must be massive (~11 M⊙, e.g., Ausseloos et al. 2006; Harrington et al. 2009), and its expected lifetime is shorter than the time required for the formation of the first PNe from the most massive progenitors of ~8 M⊙ (e.g., Weidemann 2000). As a result, HD 108719 cannot co-exist with He 2-86, unless it is a blue straggler (BS, see Ahumada & Lapasset 2007, for a comprehensive analysis of BSs in OCs). Consequently, HD 108719 does not constrain the cluster age, and the star will be ignored in the final isochrone fit. However, a BS candidate is a potentially interesting star, and we discuss its cluster membership further. To better clarify its nature, we collected a blue spectrum of HD 108719 on 2012 June 24 with the same instrument but at lower resolution (R = 2500), covering the blue range 3700–5265 Å. A portion of this spectrum is shown in Fig. 9.
HD 108719 exhibits RV variations and is very likely a binary system: we measured VR = −33 ± 7 km s-1 on April 13 and 10 ± 11 km s-1 on June 24, while Hron et al. (1985) quoted − 10.0 ± 4.6 km s-1. Those results are consistent with a BS star, which has been affected by mass transfer. Numerous multi-epoch observations are required to constrain the binary solution and to facilitate an evaluation of membership based on RVs.
The star was classified as B1 III by Fitzgerald et al. (1979). An approximate estimate of the stellar parameters was obtained by fitting the observed hydrogen and helium lines with a grid of synthetic spectra obtained from model atmospheres of solar metallicity, computed with ATLAS9 (Kurucz 1993). The Balmer series from Hβ to H12, and the four He i lines at 4026 Å, 4388 Å, 4471 Å, 4922 Å, were included in the fitting procedure. The routines developed by Bergeron et al. (1992) and Saffer et al. (1994), as modified by Napiwotzki et al. (1999), were used to derive the stellar parameters by minimizing the χ2 of the fit (for more details on the fitting procedure, see Moehler et al. 1999; Moni Bidin et al. 2012). We thus obtained Teff ≈ 24 000 K and log g ≈ 3.3, which are typical of a B1 II star. We also found that the star is a rapid rotator, with vsini ~ 200 km s-1. Unfortunately, this estimate must be considered as only approximate, because the assumed solar metallicity could be inappropriate. Our low-resolution spectrum is not suitable for an accurate metallicity measurement.
Following the spectroscopic classification criteria outlined by Gray & Corbally (2009), the spectrum for HD 108719 is consistent with a BN1 IIn star, because it exhibits enhanced nitrogen, whereas it is deficient in both oxygen and carbon. This spectral type determination differs from the one cited by Fitzgerald et al. (1979). The star displays strong N ii features (3994, 4043, 4236–41, 4530 Å) and weak O ii (4348, 4416 Å) and C ii (4267 Å) lines. The luminosity class was inferred in part from the Si iii triplet. The nitrogen enhancement could be associated with rotational mixing. Alternatively, the spectral features may be suggestive of mass transfer from a companion or a merger, which are consistent in part with the RV variations.
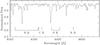 |
Fig. 9 A portion of the spectrum of HD 108719 collected on June 2012. The lines commented in the text are indicated. |
Moffat & Vogt (1973) cite V = 8.41, B − V = 0.21, and U − B = −0.63 for HD 108719. According to Wegner (2007), the absolute magnitude of a B1 III, B1 II, and B1 Ib star is MV = −3.71, −4.27, and −4.65, respectively. These values disagree with the estimates of Schmidt-Kaler (1982), namely MV = −4.4, −5.4, and −5.8. For the B1 III spectral type established by Fitzgerald et al. (1979), and the corresponding absolute magnitude from Wegner (2007), the distance to HD 108719 is d ~ 1.5 kpc. This coincides with the cluster distance established by us. However, the new spectral type classification derived here implies d ~ 1.9 kpc using the Wegner (2007) absolute magnitude or d ~ 3.3 kpc using the one established by Schmidt-Kaler (1982). Given the large spread between these two values, we derived an independent first-order determination of the absolute magnitude for a B1 II star. Bonanos et al. (2009) compiled a catalog of stars in the Large Magellanic Cloud (LMC) with optical photometry and spectroscopic classifications. Nine stars with B1 II designations are in that sample and were analyzed to infer the absolute magnitude. The distance to the LMC was adopted from Majaess et al. (2011b, μ0 = 18.43 ± 0.03; and see Borissova et al. 2009, who established it via a universal Wesenheit template, which leverages the statistical weight of the entire variable star demographic to establish precise (<5%) distances. The template capitalizes upon HST (Benedict et al. 2007), VLBA, and Hipparcos geometric distances for SX Phe, δ Scuti, RR Lyrae, and for Type II and classical Cepheid variables. A mean-color excess of E(B − V) = 0.14 is adopted for the B1 II stars and was inferred from Cepheid variables in the LMC (Majaess et al. 2009a). The resulting absolute magnitude for a B1 II is MV = −5.31 ± 0.21 ± 0.63, where the errors indicate the standard error and standard deviation, respectively. That is consistent with the value reported by Schmidt-Kaler (1982). This estimate was based on LMC stars, which are on average more metal-poor than analogous Galactic stars by Δ( [Fe/H] ) ≈ − 0.3. However, the impact of metallicity is thought to be negligible in the absolute magnitude of early-type stars, because most metal lines involved in line blanketing are absent. The small average metallicity difference between LMC and Milky Way stars therefore cannot affect our estimate noticeably. This is confirmed by inspecting Padova isochrones (Girardi et al. 2000) of metallicity Z = 0.009 and Z = 0.019, whose upper evolutionary sequences (MV < 0) differ by less than 0.1 mag. The resulting spectroscopic parallax for HD 108719 (B1 II classification) is d ~ 3.1 kpc, which implies that the star is not a cluster member.
The reddening inferred for HD 108719 using the intrinsic color cited by Schmidt-Kaler (1982) is E(B − V) ~ 0.47. This is only marginally more than what is derived for the cluster (E(B − V) = 0.41 ± 0.02, Sect. 4.3), which is approximately half as far. The latter result places firm constraints on the run of reddening along the line of sight (Neckel et al. 1980), namely that a foreground dust cloud is the primary source of obscuration for objects lying between 1.5 and 3.2 kpc.
Finally, the possibility must be considered that HD 108719 is not a hot supergiant, but a more exotic post-AGB star. This scenario would explain its unusual location in the CMD, and its cluster membership status should be reconsidered, although HD 108719 should be ignored in the isochrone fitting even in this case. The lack of dust IR emission from this star in the IRAS database (Helou & Walker 1988) argues against this hypothesis, but it does not necessarily rule it out.
4.5. Cluster age
A τ = 45−50 Myr Padova isochrone of solar metallicity simultaneously matches the cluster sequence and the two aforementioned bright stars best, as shown in Sect. 4.2. This would imply that the F-supergiant CPD-64 1943 is in the pre core-helium-burning phase and is traversing the HR-diagram for the first time. Stellar evolutionary models predict that the first-crossing is rapid, and thus the probability of observing the star in that phase is less likely than a second crossing (i.e., post onset of core-helium burning). However, as said in Sect. 4.4, HD 108719 should be ignored in the isochrone fitting. In this case, the best-fit isochrone is τ = 65 ± 10 Myr, which assumes that the F-supergiant initiated core-helium burning, and HD 108719 is either a non-member or a BS. The uncertainty stems from the offset of the isochrones that still fit the CMD reasonably well. The RVs, however, do not unequivocally prove the cluster membership of CPD-64 1943.
5. The cluster membership of He 2-86
As discussed in Sect. 1, RV matches alone are a necessary but not sufficient condition for assessing the physical connection of a PN/OC pair. Having derived the parameters of NGC 4463, we can now gather the available information to analyze the possible association of He 2-86 with this cluster.
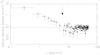 |
Fig. 10 Radial density profile of NGC 4463, obtained from 2MASS data. The radial distance of He 2-86 is indicated with an arrow. The full line shows the field level, fixed as the average of all the points with r > 10′. |
5.1. Angular distance
The angular distance between He 2-86 and the center of NGC 4463 is , that at the cluster distance corresponds to 2.9 pc. In Fig. 10 we show the cluster radial profile, constructed using 2MASS observations. The cluster’s brighter B-type stars, which rise prominently above the field in the CMD, are mostly saturated in the deeper VVV images, while available optical data are restricted to a smaller field of view. The resulting profile indicates that the cluster’s population appears significant to approximately r ~ 8–10′ and that the PN is found well within the cluster boundaries. The angular distance of He 2-86 to the cluster center is therefore compatible with its membership to NGC 4463.
5.2. The progenitor mass
He 2-86 is classified as an N-rich, Peimbert (1978) Type-I PN (Peña et al. 2013). These PNe originate in high-mass progenitors of 2–8 M⊙, a fact that is consistent with the young age obtained for NGC 4463 in Sect. 4.5, which implies a turnoff mass of 6.0 ± 0.5 M⊙.
5.3. Radial velocities and Galactic rotation
As seen in Sect. 3.4, our RV measurements for He 2-86 and NGC 4463 differ by only 4 km s-1 and are consistent within 0.9σ. However, the errors are quite large, and a RV difference of ≈8 km s-1 is still allowed within 1σ. More precise measurements are surely required to confirm the result.
In Fig. 11, we compare the RV of NGC 4463 and He 2-86 with the expected trend along their line of sight. This was obtained assuming the rotation curve of Brand & Blitz (1993), the solar peculiar motion of Schönrich et al. (2010), R⊙ = 8 ± 0.3 kpc, and VLSR = 220 ± 20 km s-1. The resulting figure confirms the early measurements of Russeil et al. (1998), who found a group of stars with a mean velocity −33 km s-1 at d = 2 kpc and a more distant one that departs from pure circular motion, close to the tangential point (d = 4.4 kpc), with VR = −40 km s-1.
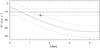 |
Fig. 11 Predicted radial velocity trend in the direction of NGC 4463 from Galactic rotation, as a function of distance from the Sun (gray solid curve). The gray dotted lines show the 1σ extremes when uncertainties in the Galactic parameters are taken into account. The estimate derived for NGC 4463 is indicated by the full dot with error bars. The horizontal full and dotted lines show the RV of He 2-86 and its 1σ spread, respectively. |
Both the OC and the PN are young, and it is reasonable to assume that they partake of the Galactic rotation to within a few km s-1. In fact, the RV of NGC 4463 matches the expectations for an object at d = 1.55 kpc within the errors. On the other hand, all the measurements (see Table 4) exclude that He 2-86 is a background object. This trend of the RV along the line of sight provides an upper limit of d < 1.6 kpc, and the difference between the PN and the Galactic disk velocity is Δ (RV) > 15 km s-1 (i.e., >4σ) if the object is assigned a distance d > 2 kpc.
5.4. Distance
Literature distance estimates for He 2-86.
The distance estimates for He 2-86 in the literature, as summarized in Table 5, span the very wide range from 1.3 to 5.1 kpc. It must be recalled, however, that they are all based on statistical methods whose results are not very reliable for a single object. The resulting lower limit d > 1.3 kpc excludes that the PN being in front of NGC 4463. By combining this information with the upper limit derived in Sect. 5.3, we can constrain the PN distance in the narrow interval d = 1.3–1.6 kpc. This matches remarkably well the cluster distance d = 1.55 ± 0.10 kpc derived in Sect. 4.3.
5.5. PN size and age
The apparent diameter of He 2-86 is ~ g (Westerlund & Henize 1967; Sahai et al. 2011). For a distance of d = 1.55 kpc, that corresponds to a physical radius of 0.04 pc, and for an expansion velocity of 22 km s-1 (Acker et al. 1992), we obtain an expansion age of ~1800 yr. A very similar result (~2200 yr) is found by adopting the procedure of Gesicki et al. (2006) and assuming their mass-averaged velocity of 14 km s-1 and a mass-averaged radius of 0.032 pc (0.8 times the outer radius). If the PN is put at d = 3 kpc (5 kpc), its radius becomes 0.08 pc (0.13 pc), with an expansion age of ~3600 yr (~5800 yr). Again, an age greater by 25% is obtained when following the Gesicki et al. (2006) method. All the values quoted for both the physical radius and the age are acceptable for a Peimbert (1978) Type-I PN, hence these results do not put constraints on its cluster membership.
5.6. Reddening
Tylenda et al. (1992) and Acker et al. (1989) estimated c = 1.86 for He 2-86, which translates into E(B − V) ≈ 1.3 mag, similar to the estimate of Frew (2008). The deep discrepancy with the reddening of NGC 4463 found in Sect. 4.3 (Δ(E(B − V)) ≈ 0.9 mag) could indicate that the PN is a background object. However, many arguments suggest that it is most likely because of heavy internal reddening.
First, the large difference between the expected interstellar reddening and the value inferred for the PN in not a unique case in the literature. For example, similar objects can be found in Zagury (2005), while Giammanco et al. (2011) find fourteen nebulae whose reddening exceeds the maximum reddening measured along their line of sight by more than one magnitude. It is also worth remembering that Giammanco et al. (2011) have shown that the PN reddening estimates cited above are affected by an uncertainty of ≈0.3 mag and by a possible systematic overestimate caused by differential atmospheric dispersion. As the same authors note, the measurements obtained from radio data are free of this effect, and they lead to systematically lower values. As an additional source of uncertainty, the extinction can largely vary across dusty PNe (e.g., Woodward et al. 1992), in particular for Type-I bipolar nebulae, such as the object of this study (e.g., Matsuura et al. 2005).
He 2-86 is a multipolar, Type-I PN with a massive progenitor (Sahai et al. 2011; Peña et al. 2013), and significant internal extinction may be expected for this kind of object from massive dusty envelopes (e.g., Corradi & Schwarz 1995). Phillips (1998) showed evidence that internal extinction increases at smaller nebular radii, and it becomes particularly relevant for small, young nebulae such as He 2-86. According to his results, an internal reddening of E(B − V) = 0.9 mag is fully consistent with his simple model for the nebular radius r = 0.04 pc, obtained from the assumption that the PN is member of NGC 4463 (Sect. 5.5). Observational evidence for a relevant amount of dust in He 2-86 is also available. In fact, deep HST images reveal a “dusty structure which produces obscuration as it cuts across the lower lobes” (Sahai et al. 2011). Both IRAS and WISE data (Helou & Walker 1988; Wright et al. 2010) consistently indicate that the PN is a bright IR source, and is indeed the brightest mid-IR source in the local field in both the W3 (12 μm) and W4 (22 μm) bands. AKARI mid- and far-infrared data (Murakami et al. 2007) corroborate the observations obtained from the aforementioned surveys. Tajitsu & Tamura (1998) fit the IRAS data with a modified blackbody function and derived a dust temperature of 134 K, and subsequently determined a distance for the PN of 1.4 kpc. We note that the latter, although uncertain, is near the distance established here for the cluster NGC 4463. On the other hand, assuming a reddening discrepancy as evidence that He 2-86 is behind NGC 4463 is inconsistent with other results presented here: the spectral classification of HD 108719 and its photometric properties indicate that the interstellar reddening beyond the cluster is nearly constant up to at least d = 3.2 kpc (Sect. 4.4), but a PN distance d > 3.2 kpc is excluded by its RV (Sect. 5.3).
In conclusion, all the available information points to high internal extinction for He 2-86. As a consequence, the reddening difference with NGC 4463 is not informative about its possible cluster membership. On the other hand, according to the study of Phillips (1998), the PN/OC association hypothesis leads to a consistent picture, where the observed extinction excess is very compatible with the inferred PN radius.
5.7. The cluster membership
As shown in this section, all the observational evidence points toward He 2-86 being a young PN member of the cluster NGC 4463, with high internal reddening. In fact, while all the data agree with this scenario, the RV of the PN excludes it being a background object, while all distance measurements in the literature exclude it from being the foreground to the cluster. The observational evidence can only be reconciled by assuming the cluster distance for the PN. He 2-86 can be background to the cluster only if its orbit in the Galaxy differs noticeably from the disk rotation. This scenario is very unlikely, because Type-I PNe such as He 2-86 are young nebulae with a massive progenitor, which formed between 20 Myr and 1 Gyr in the past, and their kinematics closely follow Galactic rotation (Peña et al. 2013). The high reddening of the PN cannot be interpreted as evidence of a background object, and its most likely explanation is internal extinction that is high but not impossible in light of the available literature.
6. Conclusions
We investigated the cluster membership of four PNe, which are found along the line of sight to known OCs. Our RV measurements demonstrate that VBe 3, and HeFa 1 are two PNe located in the Galactic bulge, with no physical relation with either NGC 5999 or NGC 6067, respectively. Conversely, the RV analysis supports cluster membership for NGC 2452 in NGC 2453. However, this determination is not definitive, as NGC 2453 is projected upon a complex and dense stellar field. Our study of the cluster RV, similarly to the estimates of its reddening and distance available in the literature, is likely to be affected by field star contamination.
Our analysis indicates that He 2-86 is a young, internally highly reddened PN, probably a member of NGC 4463. The RV of the PN agrees within the uncertainties with the RV of the cluster, and this is the only consistent scenario that can account for all the available observational evidence.
The distance and reddening for NGC 4463 were estimated using new near-infrared photometry collected by the VVV survey, in concert with optical observations. We find d = 1.55 ± 0.10 kpc and E(B − V) = 0.41 ± 0.02, and an age τ = 65 ± 10 Myr. The cluster distance and age can also be adopted for the PN He 2-86. We find that NGC 4463 hosts a PN and a core-helium burning F-type supergiant, while the binary BS candidate HD 108719 is probably a background object, as inferred from its spectral classification, which places it beyond the cluster at d ~ 3.1 kpc.
IRAF is distributed by the National Optical Astronomy Observatories, which are operated by the Association of Universities for Research in Astronomy, Inc., under cooperative agreement with the National Science Foundation.
Acknowledgments
We thank the Cambridge Astronomical Survey Unit (CASU) for processing the VISTA raw data, and R. O. Gray and B. Skiff for their comments and help. We thank the anonymous referee for the comments and suggestions. The authors acknowledge support from the Chilean Centro de Astrofísica FONDAP No. 15010003, and the Chilean Centro de Excelencia en Astrofísica y Tecnologías Afines (CATA) BASAL PFB/06. A.N.C. acknowledge support from Gemini-Conicyt No. 32110005. Support for J.B. is provided by Fondecyt Regular No. 1120601. This investigation made use of data from the Two Micron All Sky Survey, which is a joint project of the University of Massachusetts and the Infrared Processing and Analysis Center/California Institute of Technology, funded by the National Aeronautics and Space Administration and the National Science Foundation. The authors made extensive use of the SIMBAD and Vizier databases, operated at the CDS, Strasbourg, France.
References
- Acker, A., & Neiner, C. 2003, A&A, 403, 659 [NASA ADS] [CrossRef] [EDP Sciences] [Google Scholar]
- Acker, A., Jasniewicz, G., Koeppen, J., & Stenholm, B. 1989, A&AS, 80, 201 [NASA ADS] [Google Scholar]
- Acker, A., Marcout, J., Ochsenbein, F., et al. 1992, The Strasbourg-ESO Catalogue of Galactic Planetary Nebulae, Parts I, II [Google Scholar]
- Ahumada, J. A., & Lapasset, E. 2007, A&A, 463, 789 [NASA ADS] [CrossRef] [EDP Sciences] [Google Scholar]
- Amnuel, P. R., Guseinov, O. K., Novruzova, K. I., & Rustamov, I. S. 1984, Ap&SS, 107, 19 [NASA ADS] [CrossRef] [Google Scholar]
- Ausseloos, M., Aerts, C., Lefever, K., Davis, J., & Harmanec, P. 2006, A&A, 455, 259 [NASA ADS] [CrossRef] [EDP Sciences] [Google Scholar]
- Battinelli, P., & Capuzzo-Dolcetta, R. 1991, MNRAS, 249, 76 [NASA ADS] [Google Scholar]
- Benedict, G. F., McArthur, B. E., Feast, M. W., et al. 2007, AJ, 133, 1810 [NASA ADS] [CrossRef] [Google Scholar]
- Bensby, T., & Lundström, I. 2001, A&A, 374, 599 [NASA ADS] [CrossRef] [EDP Sciences] [Google Scholar]
- Bergeron, P., Saffer, R. A., & Liebert, J. 1992, ApJ, 394, 228 [NASA ADS] [CrossRef] [Google Scholar]
- Bonanos, A. Z., Massa, D. L., Sewilo, M., et al. 2009, AJ, 138, 1003 [NASA ADS] [CrossRef] [Google Scholar]
- Bonatto, C., & Bica, E. 2007, MNRAS, 377, 1301 [NASA ADS] [CrossRef] [Google Scholar]
- Bonatto, C., & Bica, E. 2010, A&A, 516, A81 [NASA ADS] [CrossRef] [EDP Sciences] [Google Scholar]
- Bonatto, C., Bica, E., & Santos, J. F. C. 2008, MNRAS, 386, 324 [NASA ADS] [CrossRef] [Google Scholar]
- Borissova, J., Rejkuba, M., Minniti, D., Catelan, M., & Ivanov, V. D. 2009, A&A, 502, 505 [NASA ADS] [CrossRef] [EDP Sciences] [Google Scholar]
- Borissova, J., Bonatto, C., Kurtev, R., et al. 2011, A&A, 532, A131 [NASA ADS] [CrossRef] [EDP Sciences] [Google Scholar]
- Brand, J., & Blitz, L. 1993, A&A, 275, 67 [NASA ADS] [Google Scholar]
- Cahn, J. H., & Kaler, J. B. 1971, ApJS, 22, 319 [NASA ADS] [CrossRef] [Google Scholar]
- Cahn, J. H., Kaler, J. B., & Stanghellini, L. 1992, A&AS, 94, 399 [NASA ADS] [Google Scholar]
- Cardelli, J. A., Clayton, G. C., & Mathis, J. S. 1989, ApJ, 345, 245 [NASA ADS] [CrossRef] [Google Scholar]
- Carraro, G., Janes, K. A., & Eastman, J. D. 2005, MNRAS, 364, 179 [NASA ADS] [CrossRef] [Google Scholar]
- Catelan, M., Minniti, D., Lucas, P. W., et al. 2011, in RR Lyrae Stars, Metal-Poor Stars, and the Galaxy, ed. A. McWilliam, 145 [Google Scholar]
- Cazetta, J. O., & Maciel, W. J. 2000, Rev. Mex. Astron. Astrofis., 36, 3 [Google Scholar]
- Cazetta, J. O., & Maciel, W. J. 2001, Ap&SS, 277, 393 [NASA ADS] [CrossRef] [Google Scholar]
- Chené, A.-N., Borissova, J., Clarke, J. R. A., et al. 2012, A&A, 545, A54 [NASA ADS] [CrossRef] [EDP Sciences] [Google Scholar]
- Coelho, P., Barbuy, B., Meléndez, J., Schiavon, R. P., & Castilho, B. V. 2005, A&A, 443, 735 [NASA ADS] [CrossRef] [EDP Sciences] [Google Scholar]
- Corradi, R. L. M., & Schwarz, H. E. 1995, A&A, 293, 871 [NASA ADS] [Google Scholar]
- Dambis, A. K. 1999, Astron. Lett., 25, 10 [Google Scholar]
- de la Fuente Marcos, R., & de la Fuente Marcos, C. 2008, ApJ, 672, 342 [NASA ADS] [CrossRef] [Google Scholar]
- Delgado, A. J., Alfaro, E. J., & Yun, J. L. 2007, A&A, 467, 1397 [NASA ADS] [CrossRef] [EDP Sciences] [Google Scholar]
- Delgado, A. J., Alfaro, E. J., & Yun, J. L. 2011, A&A, 531, A141 [NASA ADS] [CrossRef] [EDP Sciences] [Google Scholar]
- Dias, W. S., Alessi, B. S., Moitinho, A., & Lépine, J. R. D. 2002, A&A, 389, 871 [NASA ADS] [CrossRef] [EDP Sciences] [Google Scholar]
- Dopita, M. A., & Hua, C. T. 1997, ApJS, 108, 515 [NASA ADS] [CrossRef] [Google Scholar]
- Durand, S., Acker, A., & Zijlstra, A. 1998, A&AS, 132, 13 [NASA ADS] [CrossRef] [EDP Sciences] [Google Scholar]
- Eggen, O. J. 1983, AJ, 88, 379 [NASA ADS] [CrossRef] [Google Scholar]
- Emerson, J., & Sutherland, W. 2010, The Messenger, 139, 2 [NASA ADS] [Google Scholar]
- Fitzgerald, M. P., Luiken, M., Maitzen, H. M., & Moffat, A. F. J. 1979, A&AS, 37, 345 [NASA ADS] [Google Scholar]
- Fouqué, P., & Gieren, W. P. 1997, A&A, 320, 799 [NASA ADS] [Google Scholar]
- Frew, D. J. 2008, Ph.D. Thesis, Macquarie University, Australia [Google Scholar]
- Frew, D. J. & Parker, Q. A. 2006, in Planetary Nebulae in our Galaxy and Beyond, eds. M. J. Barlow, & R. H. Méndez, IAU Symp., 234, 49 [Google Scholar]
- García-Rojas, J., Peña, M., Morisset, C., Mesa-Delgado, A., & Ruiz, M. T. 2012, A&A, 538, A54 [NASA ADS] [CrossRef] [EDP Sciences] [Google Scholar]
- Gathier, R., Pottasch, S. R., & Pel, J. W. 1986, A&A, 157, 171 [NASA ADS] [Google Scholar]
- Gesicki, K., Zijlstra, A. A., Acker, A., et al. 2006, A&A, 451, 925 [NASA ADS] [CrossRef] [EDP Sciences] [Google Scholar]
- Giammanco, C., Sale, S. E., Corradi, R. L. M., et al. 2011, A&A, 525, A58 [NASA ADS] [CrossRef] [EDP Sciences] [Google Scholar]
- Girardi, L., Bressan, A., Bertelli, G., & Chiosi, C. 2000, A&AS, 141, 371 [NASA ADS] [CrossRef] [EDP Sciences] [Google Scholar]
- Glushkova, E. V., Zabolotskikh, M. V., Rastorguev, A. S., Uglova, I. M., & Fedorova, A. A. 1997, Astron. Lett., 23, 71 [NASA ADS] [Google Scholar]
- Gray, R. O., & Corbally, J., C. 2009, Stellar Spectral Classification (Princeton University Press) [Google Scholar]
- Harrington, D., Koenigsberger, G., Moreno, E., & Kuhn, J. 2009, ApJ, 704, 813 [NASA ADS] [CrossRef] [Google Scholar]
- Hasan, P., Kilambi, G. C., & Hasan, S. N. 2008, Ap&SS, 313, 363 [Google Scholar]
- Helou, G., & Walker, D. W. 1988, Infrared astronomical satellite (IRAS) catalogs and atlases, 7: The small scale structure catalog [Google Scholar]
- Henize, K. G., & Fairall, A. P. 1983, in Planetary Nebulae, ed. D. R. Flower, IAU Symp., 103, 544 [NASA ADS] [Google Scholar]
- Horne, K. 1986, PASP, 98, 609 [NASA ADS] [CrossRef] [EDP Sciences] [Google Scholar]
- Hron, J., Maitzen, H. M., Moffat, A. F. J., Schmidt-Kaler, T., & Vogt, N. 1985, A&AS, 60, 355 [NASA ADS] [Google Scholar]
- Irwin, M. J., Lewis, J., Hodgkin, S., et al. 2004, in SPIE Conf. Ser., 5493, eds. P. J. Quinn, & A. Bridger, 411 [Google Scholar]
- Jacob, R., Schönberner, D., & Steffen, M. 2013, A&A, 558, A78 [NASA ADS] [CrossRef] [EDP Sciences] [Google Scholar]
- Kharchenko, N. V., Piskunov, A. E., Röser, S., Schilbach, E., & Scholz, R.-D. 2005, A&A, 438, 1163 [NASA ADS] [CrossRef] [EDP Sciences] [MathSciNet] [Google Scholar]
- Kharchenko, N. V., Scholz, R.-D., Piskunov, A. E., Röser, S., & Schilbach, E. 2007, Astron. Nachr., 328, 889 [NASA ADS] [CrossRef] [Google Scholar]
- Kholopov, P. N. 1969, Sov. Ast., 12, 978 [NASA ADS] [Google Scholar]
- Kiss, L. L., Szabó, G. M., Balog, Z., Parker, Q. A., & Frew, D. J. 2008, MNRAS, 391, 399 [NASA ADS] [CrossRef] [Google Scholar]
- Köppen, J., & Acker, A. 2000, in Massive Stellar Clusters, eds. A. Lançon, & C. M. Boily, ASP Conf. Ser., 211, 151 [Google Scholar]
- Kurucz, R. 1993, ATLAS9 Stellar Atmosphere Programs and 2 km s-1 grid. Kurucz CD-ROM No. 13 (Cambridge, Mass.: Smithsonian Astrophysical Observatory) [Google Scholar]
- Lada, C. J., & Lada, E. A. 2003, ARA&A, 41, 57 [NASA ADS] [CrossRef] [Google Scholar]
- Larsen, S. S., & Richtler, T. 2006, A&A, 459, 103 [NASA ADS] [CrossRef] [EDP Sciences] [Google Scholar]
- MacConnell, D. J. 1981, A&AS, 44, 387 [NASA ADS] [Google Scholar]
- Maciel, W. J. 1981, A&AS, 44, 123 [NASA ADS] [Google Scholar]
- Majaess, D. J., Turner, D. G., & Lane, D. J. 2007, PASP, 119, 1349 [NASA ADS] [CrossRef] [Google Scholar]
- Majaess, D., Turner, D., & Lane, D. 2009a, Acta Astron., 59, 403 [NASA ADS] [Google Scholar]
- Majaess, D. J., Turner, D. G., & Lane, D. J. 2009b, MNRAS, 398, 263 [NASA ADS] [CrossRef] [Google Scholar]
- Majaess, D., Turner, D., Moni Bidin, C., et al. 2011a, ApJ, 741, L27 [NASA ADS] [CrossRef] [Google Scholar]
- Majaess, D. J., Turner, D. G., Lane, D. J., Henden, A. A., & Krajci, T. 2011b, J. Am. Assoc. Var. Star Observers, 39, 122 [NASA ADS] [Google Scholar]
- Majaess, D. J., Turner, D. G., Lane, D. J., & Krajci, T. 2011c, J. Am. Assoc. Var. Star Observers, 39, 219 [Google Scholar]
- Majaess, D., Turner, D., Moni Bidin, C., et al. 2012, A&A, 537, L4 [NASA ADS] [CrossRef] [EDP Sciences] [Google Scholar]
- Majaess, D., Sturch, L., Moni Bidin, C., et al. 2013, Ap&SS, 347, 61 [NASA ADS] [CrossRef] [Google Scholar]
- Mallik, D. C. V., Sagar, R., & Pati, A. K. 1995, A&AS, 114, 537 [NASA ADS] [Google Scholar]
- Matsuura, M., Zijlstra, A. A., Molster, F. J., et al. 2005, MNRAS, 359, 383 [NASA ADS] [CrossRef] [Google Scholar]
- Mauro, F., Moni Bidin, C., Chené, A.-N., et al. 2013, Rev. Mex. Astron. Astrofis., 49, 189 [NASA ADS] [Google Scholar]
- Meatheringham, S. J., Wood, P. R., & Faulkner, D. J. 1988, ApJ, 334, 862 [NASA ADS] [CrossRef] [Google Scholar]
- Mendez, R. H., & Niemela, V. S. 1981, ApJ, 250, 240 [NASA ADS] [CrossRef] [Google Scholar]
- Mermilliod, J. 1996, in The Origins, Evolution, and Destinies of Binary Stars in Clusters, eds. E. F. Milone, & J.-C. Mermilliod, ASP Conf. Ser., 90, 475 [Google Scholar]
- Mermilliod, J.-C., & Paunzen, E. 2003, A&A, 410, 511 [NASA ADS] [CrossRef] [EDP Sciences] [Google Scholar]
- Mermilliod, J. C., Mayor, M., & Burki, G. 1987, A&AS, 70, 389 [NASA ADS] [Google Scholar]
- Mermilliod, J. C., Mayor, M., & Udry, S. 2008, A&A, 485, 303 [NASA ADS] [CrossRef] [EDP Sciences] [Google Scholar]
- Minniti, D., Lucas, P. W., Emerson, J. P., et al. 2010, New A, 15, 433 [NASA ADS] [CrossRef] [Google Scholar]
- Moehler, S., Sweigart, A. V., & Catelan, M. 1999, A&A, 351, 519 [NASA ADS] [Google Scholar]
- Moffat, A. F. J., & Fitzgerald, M. P. 1974, A&AS, 18, 19 [NASA ADS] [Google Scholar]
- Moffat, A. F. J., & Vogt, N. 1973, A&AS, 10, 135 [NASA ADS] [Google Scholar]
- Moitinho, A., Vázquez, R. A., Carraro, G., et al. 2006, MNRAS, 368, L77 [NASA ADS] [CrossRef] [Google Scholar]
- Moni Bidin, C., Moehler, S., Piotto, G., et al. 2006, A&A, 451, 499 [NASA ADS] [CrossRef] [EDP Sciences] [Google Scholar]
- Moni Bidin, C., Mauro, F., Geisler, D., et al. 2011a, A&A, 535, A33 [NASA ADS] [CrossRef] [EDP Sciences] [Google Scholar]
- Moni Bidin, C., Villanova, S., Piotto, G., & Momany, Y. 2011b, A&A, 528, A127 [NASA ADS] [CrossRef] [EDP Sciences] [Google Scholar]
- Moni Bidin, C., Villanova, S., Piotto, G., et al. 2012, A&A, 547, A109 [NASA ADS] [CrossRef] [EDP Sciences] [Google Scholar]
- Morse, J. A., Mathieu, R. D., & Levine, S. E. 1991, AJ, 101, 1495 [NASA ADS] [CrossRef] [Google Scholar]
- Murakami, H., Baba, H., Barthel, P., et al. 2007, PASJ, 59, 369 [Google Scholar]
- Napiwotzki, R., Green, P. J., & Saffer, R. A. 1999, ApJ, 517, 399 [NASA ADS] [CrossRef] [Google Scholar]
- Neckel, T., Klare, G., & Sarcander, M. 1980, A&AS, 42, 251 [NASA ADS] [Google Scholar]
- Netopil, M., Paunzen, E., Maitzen, H. M., et al. 2007, A&A, 462, 591 [NASA ADS] [CrossRef] [EDP Sciences] [Google Scholar]
- Osterbrock, D. E., & Ferland, G. J. 2006, Astrophysics of gaseous nebulae and active galactic nuclei (University Science Books) [Google Scholar]
- Parker, Q. A., Acker, A., Frew, D. J., et al. 2006, MNRAS, 373, 79 [NASA ADS] [CrossRef] [Google Scholar]
- Parker, Q. A., Frew, D. J., Miszalski, B., et al. 2011, MNRAS, 413, 1835 [NASA ADS] [CrossRef] [Google Scholar]
- Pauls, R., & Kohoutek, L. 1996, Astron. Nachr., 317, 413 [NASA ADS] [CrossRef] [Google Scholar]
- Peña, M., Rechy-García, J. S., & García-Rojas, J. 2013, Rev. Mex. Astron. Astrophis., 49, 87 [NASA ADS] [Google Scholar]
- Peimbert, M. 1978, in Planetary Nebulae, ed. Y. Terzian, IAU Symp., 76, 215 [Google Scholar]
- Phelps, R. L., Janes, K. A., & Montgomery, K. A. 1994, AJ, 107, 1079 [NASA ADS] [CrossRef] [Google Scholar]
- Phillips, J. P. 1998, A&A, 336, 986 [NASA ADS] [Google Scholar]
- Phillips, J. P. 2002, ApJS, 139, 199 [NASA ADS] [CrossRef] [Google Scholar]
- Phillips, J. P. 2004a, MNRAS, 353, 589 [NASA ADS] [CrossRef] [Google Scholar]
- Phillips, J. P. 2004b, New A, 9, 391 [NASA ADS] [CrossRef] [Google Scholar]
- Piatti, A. E., Claria, J. J., & Bica, E. 1999, MNRAS, 303, 65 [NASA ADS] [CrossRef] [Google Scholar]
- Roeser, S., Demleitner, M., & Schilbach, E. 2010, AJ, 139, 2440 [NASA ADS] [CrossRef] [Google Scholar]
- Russeil, D., Georgelin, Y. M., Amram, P., et al. 1998, A&AS, 130, 119 [NASA ADS] [CrossRef] [EDP Sciences] [Google Scholar]
- Saffer, R. A., Bergeron, P., Koester, D., & Liebert, J. 1994, ApJ, 432, 351 [NASA ADS] [CrossRef] [Google Scholar]
- Sahai, R., Morris, M. R., & Villar, G. G. 2011, AJ, 141, 134 [NASA ADS] [CrossRef] [Google Scholar]
- Saito, R., Hempel, M., Alonso-García, J., et al. 2010, The Messenger, 141, 24 [NASA ADS] [Google Scholar]
- Saito, R. K., Hempel, M., Minniti, D., et al. 2012, A&A, 537, A107 [NASA ADS] [CrossRef] [EDP Sciences] [Google Scholar]
- Santos, Jr., J. F. C., & Bica, E. 1993, MNRAS, 260, 915 [NASA ADS] [CrossRef] [Google Scholar]
- Schmidt-Kaler, T. 1982, Bulletin d’Information du Centre de Données Stellaires, 23, 2 [Google Scholar]
- Schönberner, D., & Blöcker, T. 1996, Ap&SS, 245, 201 [NASA ADS] [CrossRef] [Google Scholar]
- Schönrich, R., Binney, J., & Dehnen, W. 2010, MNRAS, 403, 1829 [NASA ADS] [CrossRef] [Google Scholar]
- Schweizer, F. 1979, PASP, 91, 149 [NASA ADS] [CrossRef] [Google Scholar]
- Simkin, S. M. 1974, A&A, 31, 129 [NASA ADS] [Google Scholar]
- Skrutskie, M. F., Cutri, R. M., Stiening, R., et al. 2006, AJ, 131, 1163 [NASA ADS] [CrossRef] [Google Scholar]
- Soderblom, D. R., Nelan, E., Benedict, G. F., et al. 2005, AJ, 129, 1616 [NASA ADS] [CrossRef] [Google Scholar]
- Stetson, P. B. 1987, PASP, 99, 191 [NASA ADS] [CrossRef] [Google Scholar]
- Stetson, P. B. 1994, PASP, 106, 250 [NASA ADS] [CrossRef] [Google Scholar]
- Storm, J., Gieren, W., Fouqué, P., et al. 2011, A&A, 534, A94 [NASA ADS] [CrossRef] [EDP Sciences] [Google Scholar]
- Tajitsu, A., & Tamura, S. 1998, AJ, 115, 1989 [NASA ADS] [CrossRef] [Google Scholar]
- Tonry, J., & Davis, M. 1979, AJ, 84, 1511 [NASA ADS] [CrossRef] [Google Scholar]
- Turner, D. G. 1976, AJ, 81, 1125 [NASA ADS] [CrossRef] [Google Scholar]
- Turner, D. G. 1989, AJ, 98, 2300 [NASA ADS] [CrossRef] [Google Scholar]
- Turner, D. G. 2010, Ap&SS, 326, 219 [NASA ADS] [CrossRef] [Google Scholar]
- Turner, D. G., Rosvick, J. M., Balam, D. D., et al. 2011, PASP, 123, 1249 [NASA ADS] [CrossRef] [Google Scholar]
- Tylenda, R., Acker, A., Stenholm, B., & Koeppen, J. 1992, A&AS, 95, 337 [NASA ADS] [Google Scholar]
- van de Steene, G. C., & Zijlstra, A. A. 1994, A&AS, 108, 485 [NASA ADS] [Google Scholar]
- van Leeuwen, F. 2009, A&A, 497, 209 [NASA ADS] [CrossRef] [EDP Sciences] [Google Scholar]
- Wegner, W. 2007, MNRAS, 374, 1549 [NASA ADS] [CrossRef] [Google Scholar]
- Weidemann, V. 2000, A&A, 363, 647 [NASA ADS] [Google Scholar]
- Westerlund, B. E., & Henize, K. G. 1967, ApJS, 14, 154 [NASA ADS] [CrossRef] [Google Scholar]
- Wilson, R. E. 1953, General catalogue of stellar radial velocities (Washington: Carnegie Institution of Washington) [Google Scholar]
- Woodward, C. E., Pipher, J. L., Forrest, W. J., Moneti, A., & Shure, M. A. 1992, ApJ, 385, 567 [NASA ADS] [CrossRef] [Google Scholar]
- Wright, E. L., Eisenhardt, P. R. M., Mainzer, A. K., et al. 2010, AJ, 140, 1868 [NASA ADS] [CrossRef] [Google Scholar]
- Zagury, F. 2005, New A, 10, 237 [NASA ADS] [CrossRef] [Google Scholar]
- Zhang, C. Y. 1995, ApJS, 98, 659 [NASA ADS] [CrossRef] [Google Scholar]
All Tables
All Figures
|
Fig. 1 Color–magnitude diagrams of the program clusters. The 2MASS point sources within 3′ from the cluster center are plotted as small dots. Full circles indicate the selected targets, while empty circles convey the positions of stars that entered the slit fortuitously. |
| In the text | |
|
Fig. 2 Examples of the collected spectra. The spectra have been shifted vertically to avoid overlap. |
| In the text | |
|
Fig. 3 Spectra of the target PNe. The spectra have been shifted vertically to avoid overlap, and that of He 2-86 was vertically reduced by a factor of ten. |
| In the text | |
|
Fig. 4 Proper motions of stars within from the center of NGC 2453. The observed targets and additional stars are indicated with full and empty dots, respectively. |
| In the text | |
|
Fig. 5 Radial velocity distribution of the stars observed in NGC 4463. |
| In the text | |
|
Fig. 6 CMDs of NGC 4463 extracted for r = 1′ (left panels) and (right). Panels show the observed (top), same-area sky (middle) and decontaminated (bottom) CMDs. A 50 Myr Padova isochrone of solar metallicity was shifted by E(J − H) = 0.13 and d⊙ = 1.54 kpc. |
| In the text | |
|
Fig. 7 Optical color-color diagrams for stars lying within of the center of NGC 4463 (left panel) and in the surrounding field (, right panel). Overplotted is the intrinsic relation of Turner (1989) (dashed curve), and that relation shifted by E(B − V) = 0.42 (solid curve). |
| In the text | |
|
Fig. 8 IR and optical CMDs for stars within from the center of NGC 4463. The curves indicate the isochrone described in the text. The empty circle highlights the position of the star HD 108719. |
| In the text | |
|
Fig. 9 A portion of the spectrum of HD 108719 collected on June 2012. The lines commented in the text are indicated. |
| In the text | |
|
Fig. 10 Radial density profile of NGC 4463, obtained from 2MASS data. The radial distance of He 2-86 is indicated with an arrow. The full line shows the field level, fixed as the average of all the points with r > 10′. |
| In the text | |
|
Fig. 11 Predicted radial velocity trend in the direction of NGC 4463 from Galactic rotation, as a function of distance from the Sun (gray solid curve). The gray dotted lines show the 1σ extremes when uncertainties in the Galactic parameters are taken into account. The estimate derived for NGC 4463 is indicated by the full dot with error bars. The horizontal full and dotted lines show the RV of He 2-86 and its 1σ spread, respectively. |
| In the text | |
Current usage metrics show cumulative count of Article Views (full-text article views including HTML views, PDF and ePub downloads, according to the available data) and Abstracts Views on Vision4Press platform.
Data correspond to usage on the plateform after 2015. The current usage metrics is available 48-96 hours after online publication and is updated daily on week days.
Initial download of the metrics may take a while.