Free Access
Fig. 7
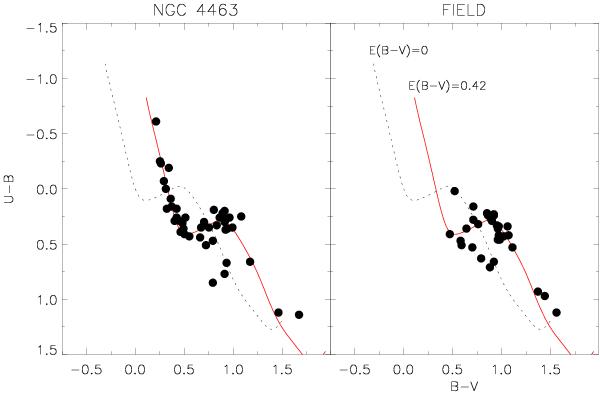
Optical color-color diagrams for stars lying within of the center of NGC 4463 (left panel) and in the surrounding field (, right panel). Overplotted is the intrinsic relation of Turner (1989) (dashed curve), and that relation shifted by E(B − V) = 0.42 (solid curve).
Current usage metrics show cumulative count of Article Views (full-text article views including HTML views, PDF and ePub downloads, according to the available data) and Abstracts Views on Vision4Press platform.
Data correspond to usage on the plateform after 2015. The current usage metrics is available 48-96 hours after online publication and is updated daily on week days.
Initial download of the metrics may take a while.