Fig. 3
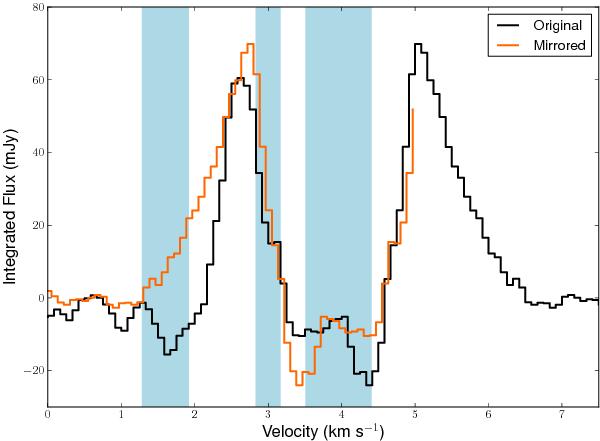
C18O (2−1) line profile. The unaltered spectral profile (black) is overlaid with a portion of the spectral profile mirrored about 4.0 km s-1 (orange). Light blue areas mark the widths obtained from the best- fit thin disk model (Table 3) of the foreground material (1.6 and 3 km s-1) and the envelope (4.0 km s-1). The horizontal line between 5 and 6.5 km s-1 shows the velocity range used for the UV-space PV diagram.
Current usage metrics show cumulative count of Article Views (full-text article views including HTML views, PDF and ePub downloads, according to the available data) and Abstracts Views on Vision4Press platform.
Data correspond to usage on the plateform after 2015. The current usage metrics is available 48-96 hours after online publication and is updated daily on week days.
Initial download of the metrics may take a while.