Fig. 8
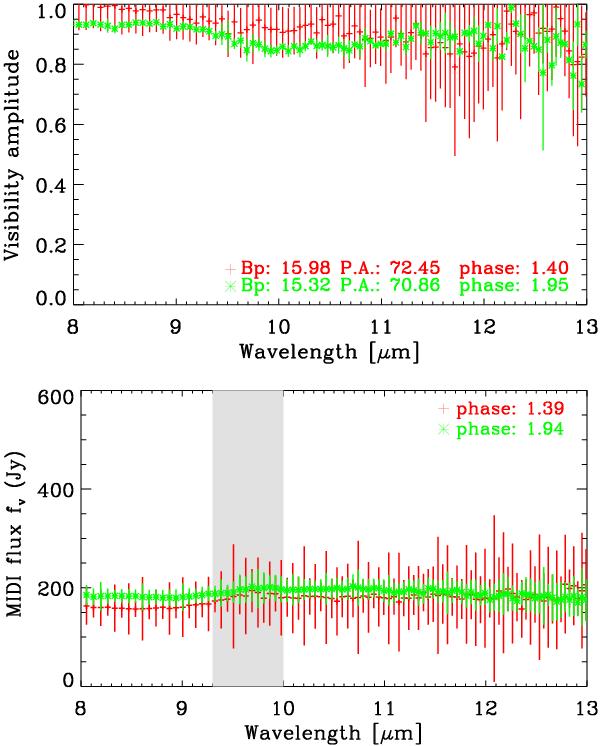
Example of a test for intra-cycle visibility (top) and photometry (bottom) variability of S Ori. The red lines denote a pre-minimum phase of 1.39 and the green lines a pre-maximum phase of 1.94. The visibility observations were obtained at similar projected baseline lengths of ~15 m and similar position angles of ~71 °. Both lines were computed as an average of data obtained at the respective phase (±0.15), and for the visibility data at the respective projected baseline length (Bp ± 10%) and position angle (PA ± 10%) (see Table 8).
Current usage metrics show cumulative count of Article Views (full-text article views including HTML views, PDF and ePub downloads, according to the available data) and Abstracts Views on Vision4Press platform.
Data correspond to usage on the plateform after 2015. The current usage metrics is available 48-96 hours after online publication and is updated daily on week days.
Initial download of the metrics may take a while.