Fig. 5
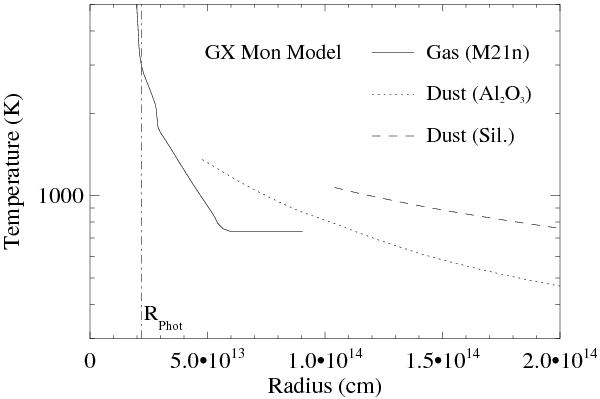
Stratification of the gas temperature and dust temperature (Al2O3 and silicate dust) for the example of our GX Mon model. The solid line shows the gas temperature (model M21n), the dotted line the dust temperature of the Al2O3 dust shell, and the dashed line the dust temperature of the silicate dust shell. The vertical line indicates RPhot = 2.19 × 1013 cm. For the model parameters, see Table 7.
Current usage metrics show cumulative count of Article Views (full-text article views including HTML views, PDF and ePub downloads, according to the available data) and Abstracts Views on Vision4Press platform.
Data correspond to usage on the plateform after 2015. The current usage metrics is available 48-96 hours after online publication and is updated daily on week days.
Initial download of the metrics may take a while.