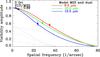
Fig. 2
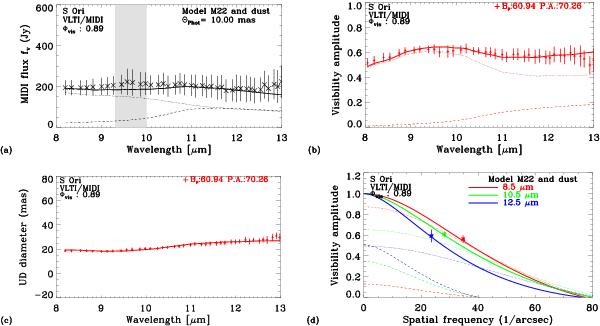
VLTI/MIDI interferometry at 8–13 μm of S Ori for the example of epoch B (stellar phase 0.89, see Table 1). The panels show (upper left) the flux, (upper right) the visibility amplitude, (lower left) the corresponding UD diameter, and (lower right) the visibility amplitude as a function of spatial frequency for three averaged band passes of 8–9 μm, 10–11 μm, and 12–13 μm. The gray shade indicates the wavelength region around 9.5 μm that is affected by atmospheric absorption. The crosses with error bars denote the measured values. The solid lines indicate our best-fit model. The contributions of the stellar and dust components alone are indicated by the dotted and the dashed line, respectively.
Current usage metrics show cumulative count of Article Views (full-text article views including HTML views, PDF and ePub downloads, according to the available data) and Abstracts Views on Vision4Press platform.
Data correspond to usage on the plateform after 2015. The current usage metrics is available 48-96 hours after online publication and is updated daily on week days.
Initial download of the metrics may take a while.