Fig. 3
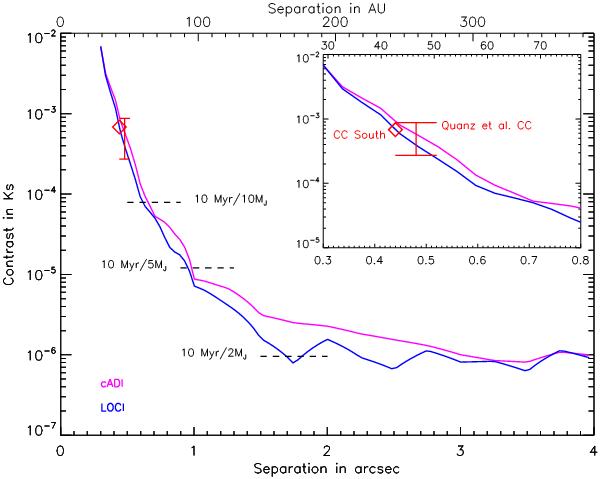
Limit of detection calculated for cADI and LOCI. The red bar shows the expected position in the contrast/separation diagram of the Quanz et al. (2013) candidate planet for which the Ks contrasts are extrapolated from the Lp photometry. The contrast of a few particular masses (2, 5, and 10 MJ) provided by the BT-SETTL model are plotted for an age of 10 Myr (dashed lines). The red diamond gives the contrast of a candidate companion suspected from the NICI data and located at ρ = 0.44′′, PA = 194.1°. The top-right subpanel shows a zoom-in version of the same plot.
Current usage metrics show cumulative count of Article Views (full-text article views including HTML views, PDF and ePub downloads, according to the available data) and Abstracts Views on Vision4Press platform.
Data correspond to usage on the plateform after 2015. The current usage metrics is available 48-96 hours after online publication and is updated daily on week days.
Initial download of the metrics may take a while.