Free Access
Fig. 7
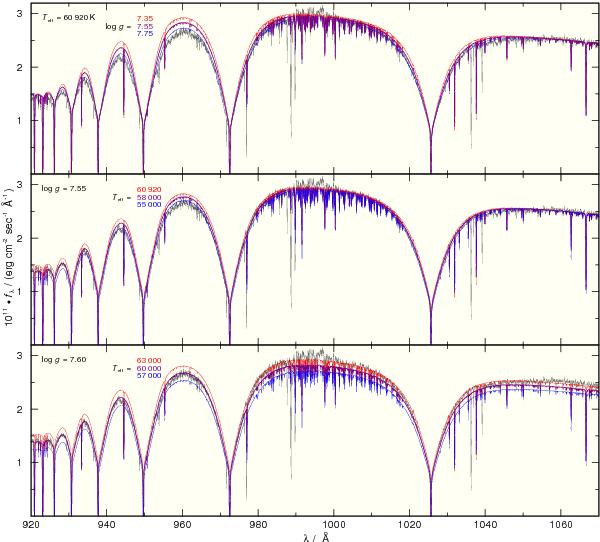
Section of the FUSE observation compared with our model fluxes with different Teff and log g. In the top and middle panels, the synthetic fluxes are normalized to the observed flux at 1000 Å and in the bottom panel to the observed K magnitude (see Fig. 4). EB − V and NH i are applied using our results from Sect. 2.3.
Current usage metrics show cumulative count of Article Views (full-text article views including HTML views, PDF and ePub downloads, according to the available data) and Abstracts Views on Vision4Press platform.
Data correspond to usage on the plateform after 2015. The current usage metrics is available 48-96 hours after online publication and is updated daily on week days.
Initial download of the metrics may take a while.