Free Access
Fig. 25
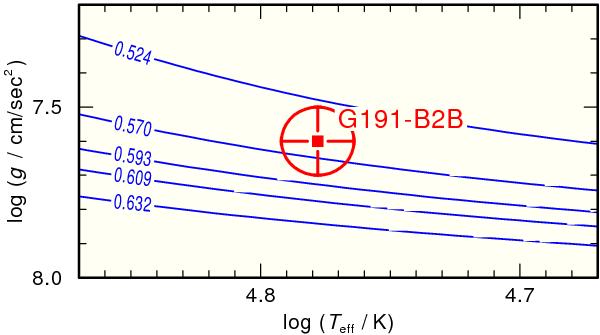
Location of G191−B2B in the log Teff–log g plane (the ellipse indicates the errors of our analysis) compared with evolutionary tracks for hydrogen-rich white dwarfs (Renedo et al. 2010) labeled with the respective stellar masses (in M⊙).
Current usage metrics show cumulative count of Article Views (full-text article views including HTML views, PDF and ePub downloads, according to the available data) and Abstracts Views on Vision4Press platform.
Data correspond to usage on the plateform after 2015. The current usage metrics is available 48-96 hours after online publication and is updated daily on week days.
Initial download of the metrics may take a while.