Fig. 18
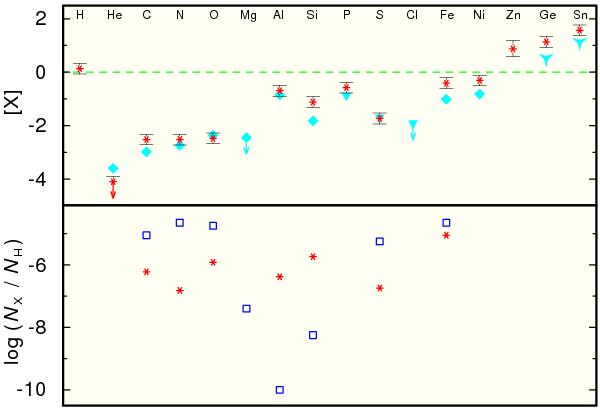
Top: photospheric abundances of G191−B2B (red stars) compared with solar values (Asplund et al. 2009). [X] denotes log (mass fraction/solar mass fraction) of element X. The dashed, green line shows the solar ratio. The arrows indicate upper limits. The cyan diamonds (Holberg et al. 2003), triangles (Vennes et al. 1996), and tridents (Vennes et al. 2005) are previously determined values. Bottom: comparison of our abundance number ratios (red stars) with predictions of diffusion calculations for DA-type (blue squares) WDs (Chayer et al. 1995) with and log g = 7.5.
Current usage metrics show cumulative count of Article Views (full-text article views including HTML views, PDF and ePub downloads, according to the available data) and Abstracts Views on Vision4Press platform.
Data correspond to usage on the plateform after 2015. The current usage metrics is available 48-96 hours after online publication and is updated daily on week days.
Initial download of the metrics may take a while.